

What would I like to do?
I would like to add infinite line y = x to chart.
I executed the following code.
plot = figure()
plot.scatter(x=[1, 10, 100], y=[1,2,4])
plot.ray(x=[0], y=[0], length=0, angle=math.pi/4)
show(plot)
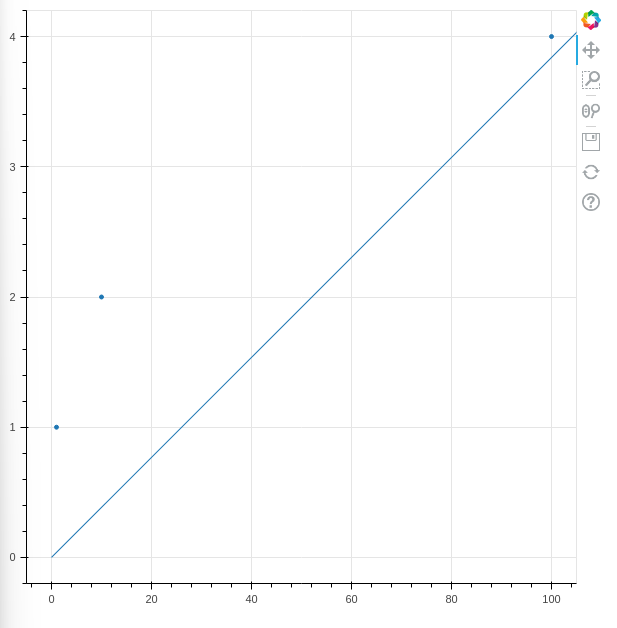
The gradient is 45° in screen units but is not 45° in data units.
The line is not y = x
Question
How do I add line y=x with ray method?
Environmental
- Python3.10.2
- bokeh 2.4.3
Supplementary
I referred to the following site.


