 Read-only archive⌕

Certainly, but there is nothing in Bokeh that will do it automatically. You would position things yourself, with LabelSet (or possibly the text glyph).
OK, I will try the LabelSet. But the legends seem can not be hidden.
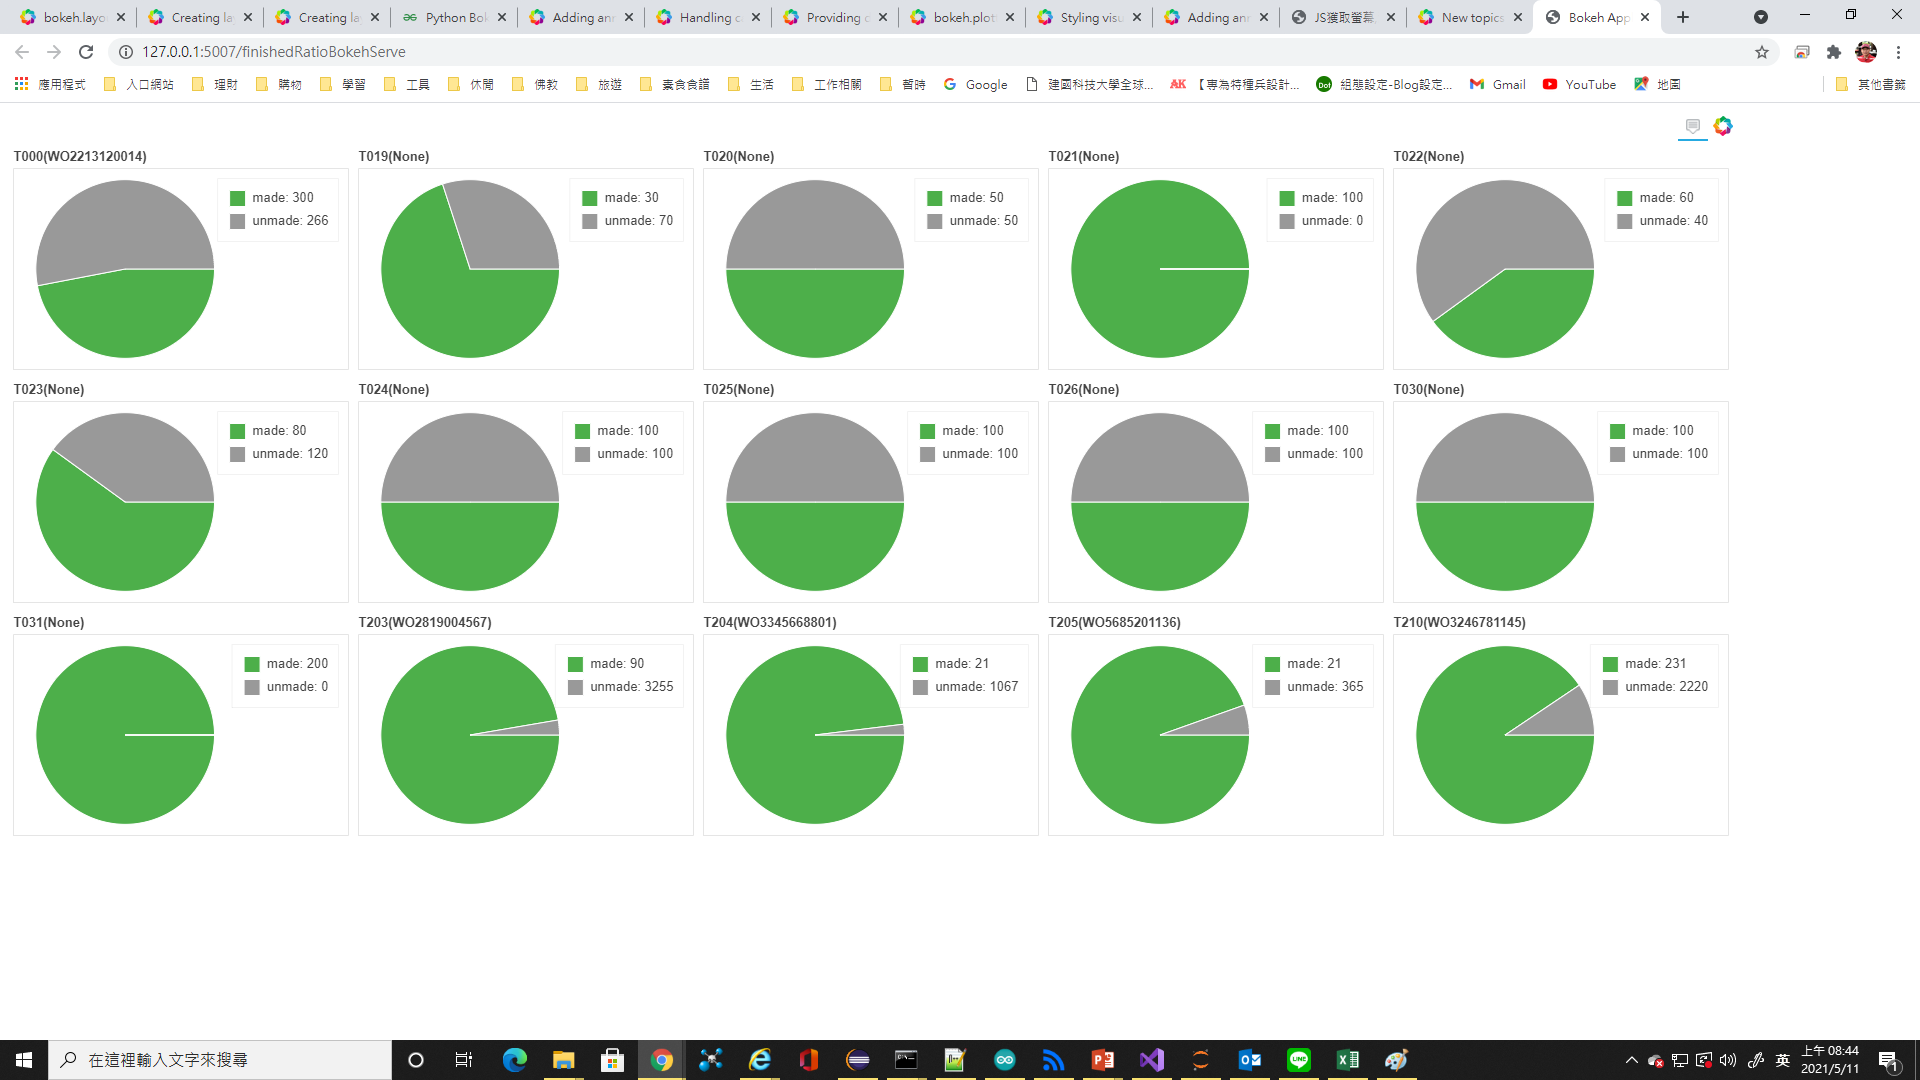
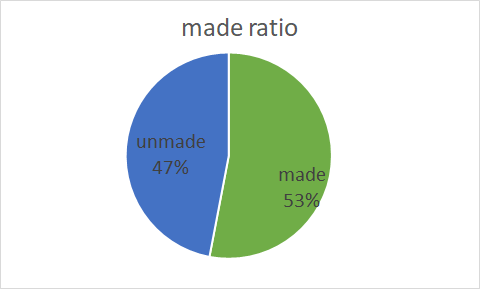
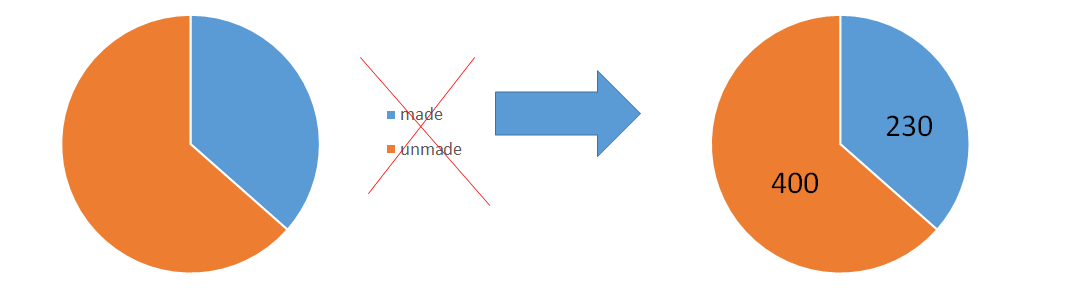
If I add labels into the pie like right-hand side, then the legend does not need anymore. I don’t known how to hide or delete the legend?
Leave off whatever legend_* parameter you are currently passing to there glyph function.
Thank you very much!
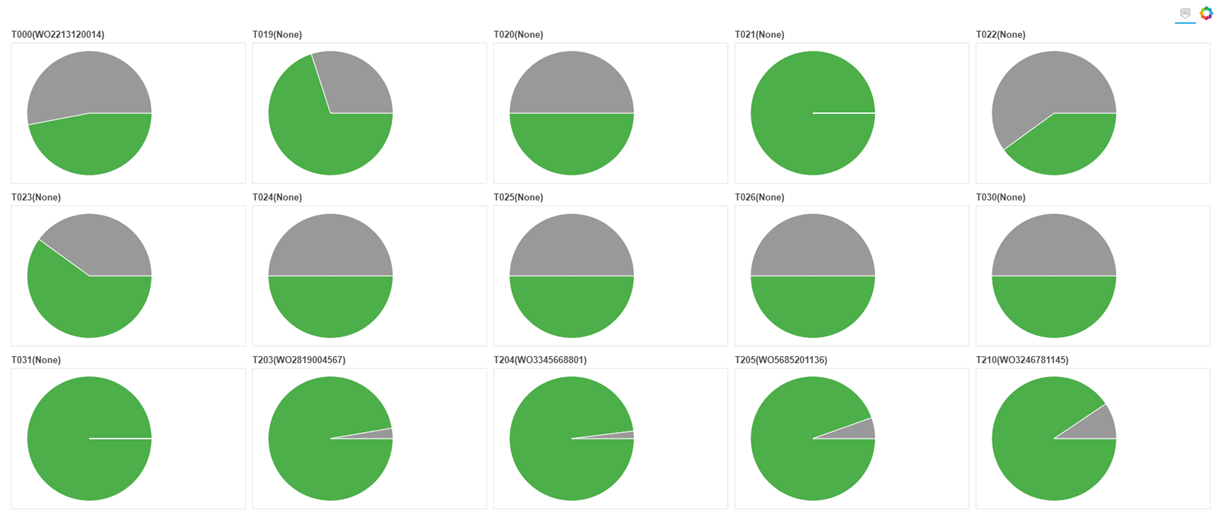
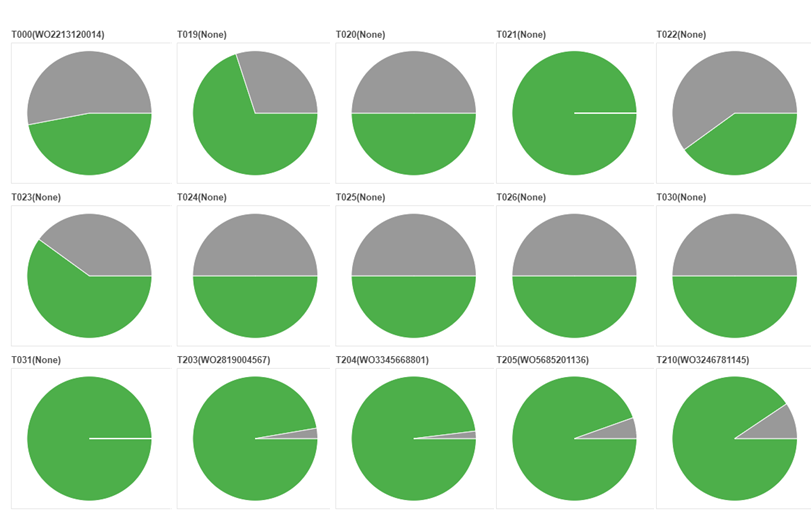
One more question! Leaving off legend_* parameter really make legends hide. However, no matter what plot_width I set, the gridplot is now like the picture below.
It seems like you must have explicitly set the range start/end to make room for the legends? You will need to adjust that accordingly. Avoiding all this speculation is why it is always important to provide real, actual code for people to examine.
Thank you for your reminders.
My original codes are,
plot = figure(title=itemInfos, toolbar_location=None, tools=“hover”, tooltips="@countItem: @value", x_range=(-0.5, 1.0))
plot.wedge(x=0, y=1, radius=0.4, start_angle=cumsum(‘angle’, include_zero=True), end_angle=cumsum(‘angle’), direction=‘anticlock’, line_color=“white”, fill_color=‘color’, source=wedgesDataSource[i])
plot.wedge(x=0, y=1, radius=0.4, start_angle=cumsum(‘angle’, include_zero=True), end_angle=cumsum(‘angle’), direction=‘anticlock’, line_color=“white”, fill_color=‘color’, source=wedgesDataSource[i])
…
grid = gridplot(ratioPlot, ncols=columnAmount, sizing_mode=“stretch_both”)
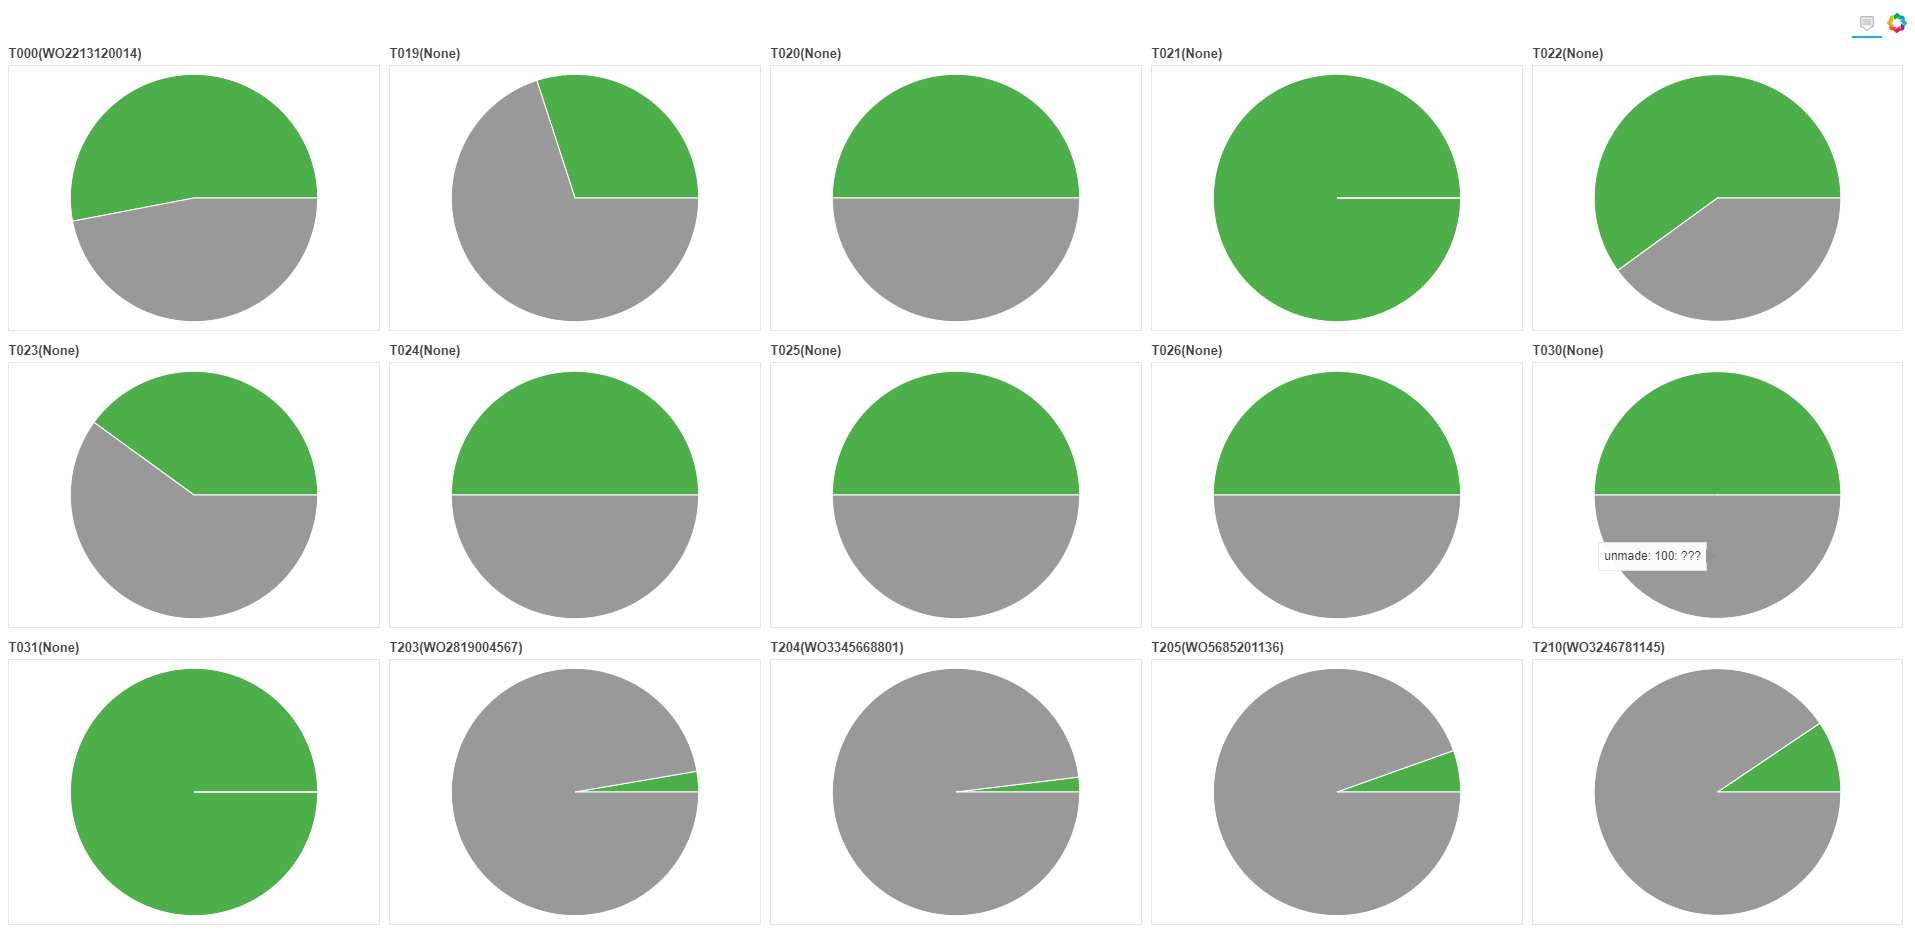
If the first line changed as the following, then the figure looks like …
plot = figure(title=itemInfos, toolbar_location=None, tools=“hover”, tooltips="@countItem: @value", x_range=(-0.6, 0.6), y_range=(-3, 5))
It looks good, but I don’t really understand what is the rule regarding x_range and y_range of the pie chart.
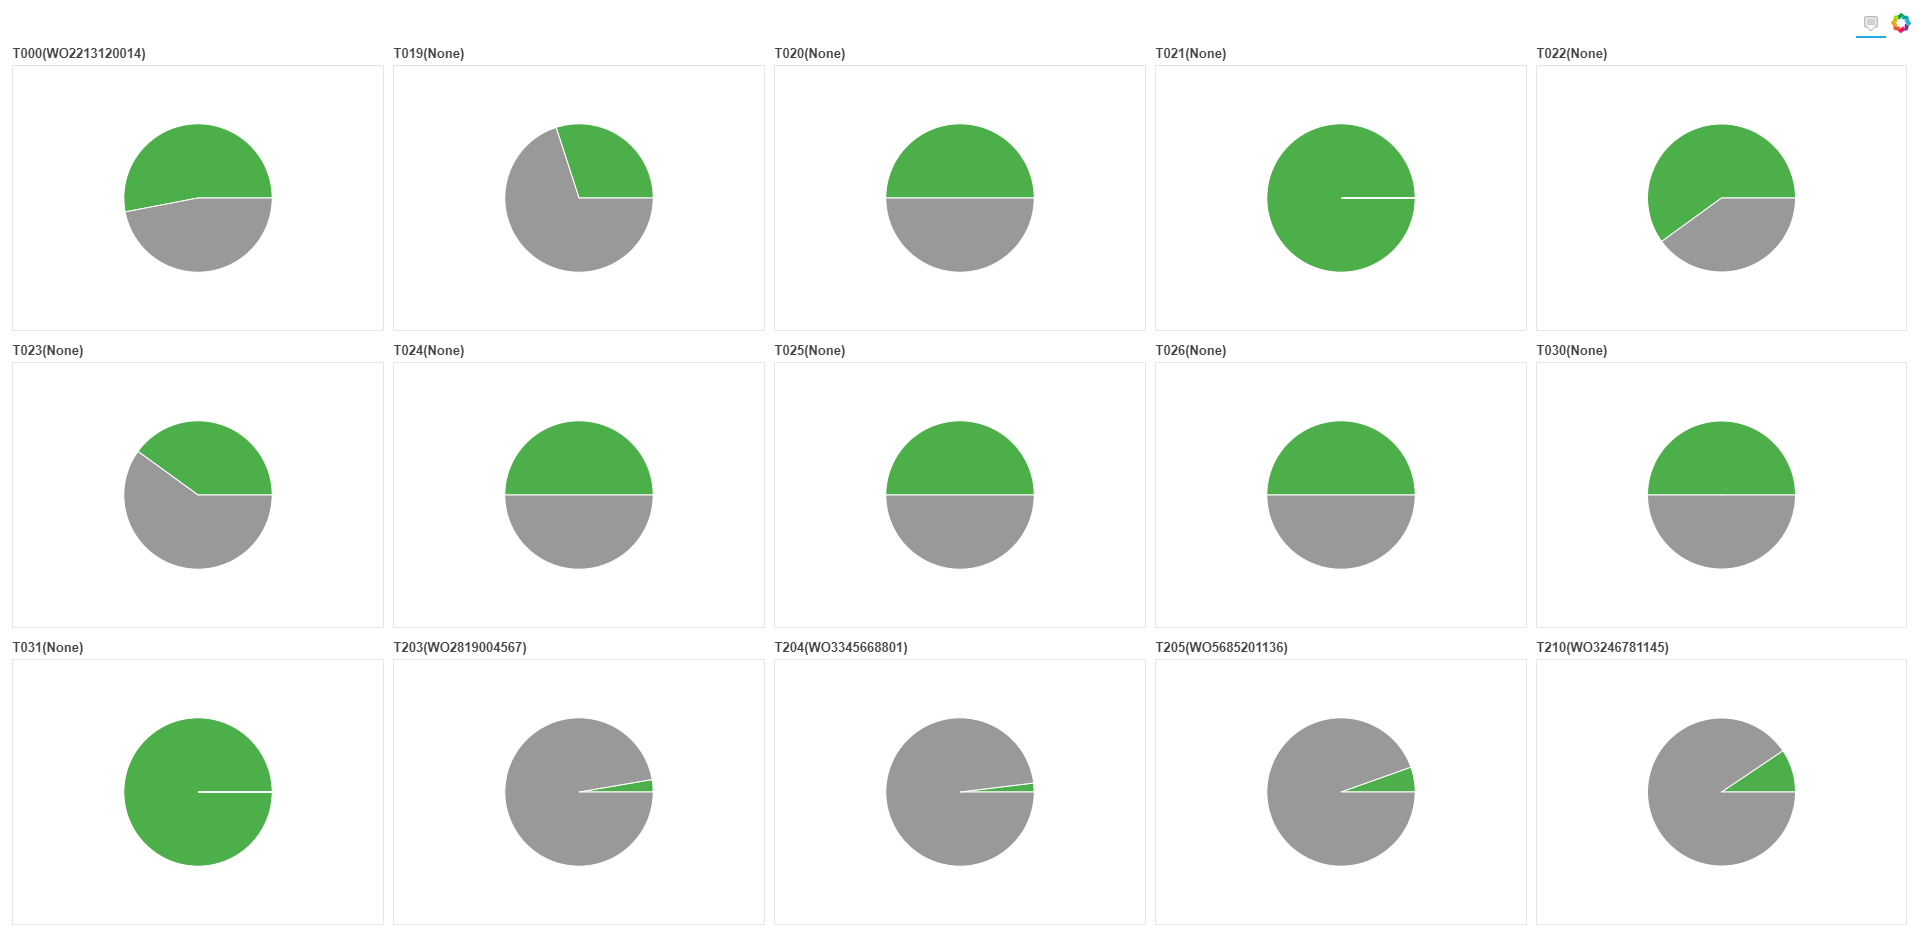
The last figure is changing x_range and y_range like the follows,
plot = figure(title=itemInfos, toolbar_location=None, tools=“hover”, tooltips="@countItem: @value", plot.x_range.range_padding = 0, plot.y_range.range_padding = 0)
There’s no rule, those are simply the start and end values of the axis. It might help if you temporarily turn axes on the plots so that you can observe how your change to the range values affect the plot.
Also for the future, please always use code formatting so that the code is intelligible (either with the </> icon on the editing toolbar, or triple backtick ``` fences around the code blocks)
End of archived discussion · Replies are disabled