Ok. I may not have bandwidth to write this all out explicitly for you but I can give some guidance on logic/what you need to implement.
First of all, you absolutely can do this with bokeh and it’s awesome  Secondly though, it’s gonna take more effort than you probably want, primarily due to the standalone requirement. To build standalone you will need CustomJS, and you essentially need CustomJS that will do the pseudocode “SQL-ish” equivalent of:
select avg(fieldyouwantaverage), count(fieldyouwanttocount) --i.e. all your aggregations
from your CDS where CDS indices are selected --i.e. everything from your CDS that is currently selected
group by [fieldyouwanttogroupby],[anotherfieldyouwanttogroupby] --i.e. doing the aggregation in groups  as per certain fields
I would avoid writing vanilla JS code to do this, but rather look to leveraging existing JS libraries. d3 (d3.group, d3.rollup, d3.index / D3 / Observable) can do this, and maybe simpler but not as robust (e.g. no custom aggregation etc) alasql (http://alasql.org/) can also.
The overall logic would be
- store your data in a CDS (i.e. the “primary” datasource)
- instantiate another CDS (i.e. the “aggresult” datasource), with column names equivalent to what you want your pivot table to be and empty lists as their initial values
- plot your “primary” CDS with the user ability to select it (lasso select etc.)
- create a table with columns, running off off your “aggresult” datasource
- write a callback that will:
a) complete the above outlined pseudo-sql logic
b) update the “aggresult” datasource with that result
I’ve built in essence the same thing for evaluating calibration statistics (i.e. goodness of model fit) over an arbitrary user-defined selection, grouping by multiple fields etc and presenting results in different tables on the fly:
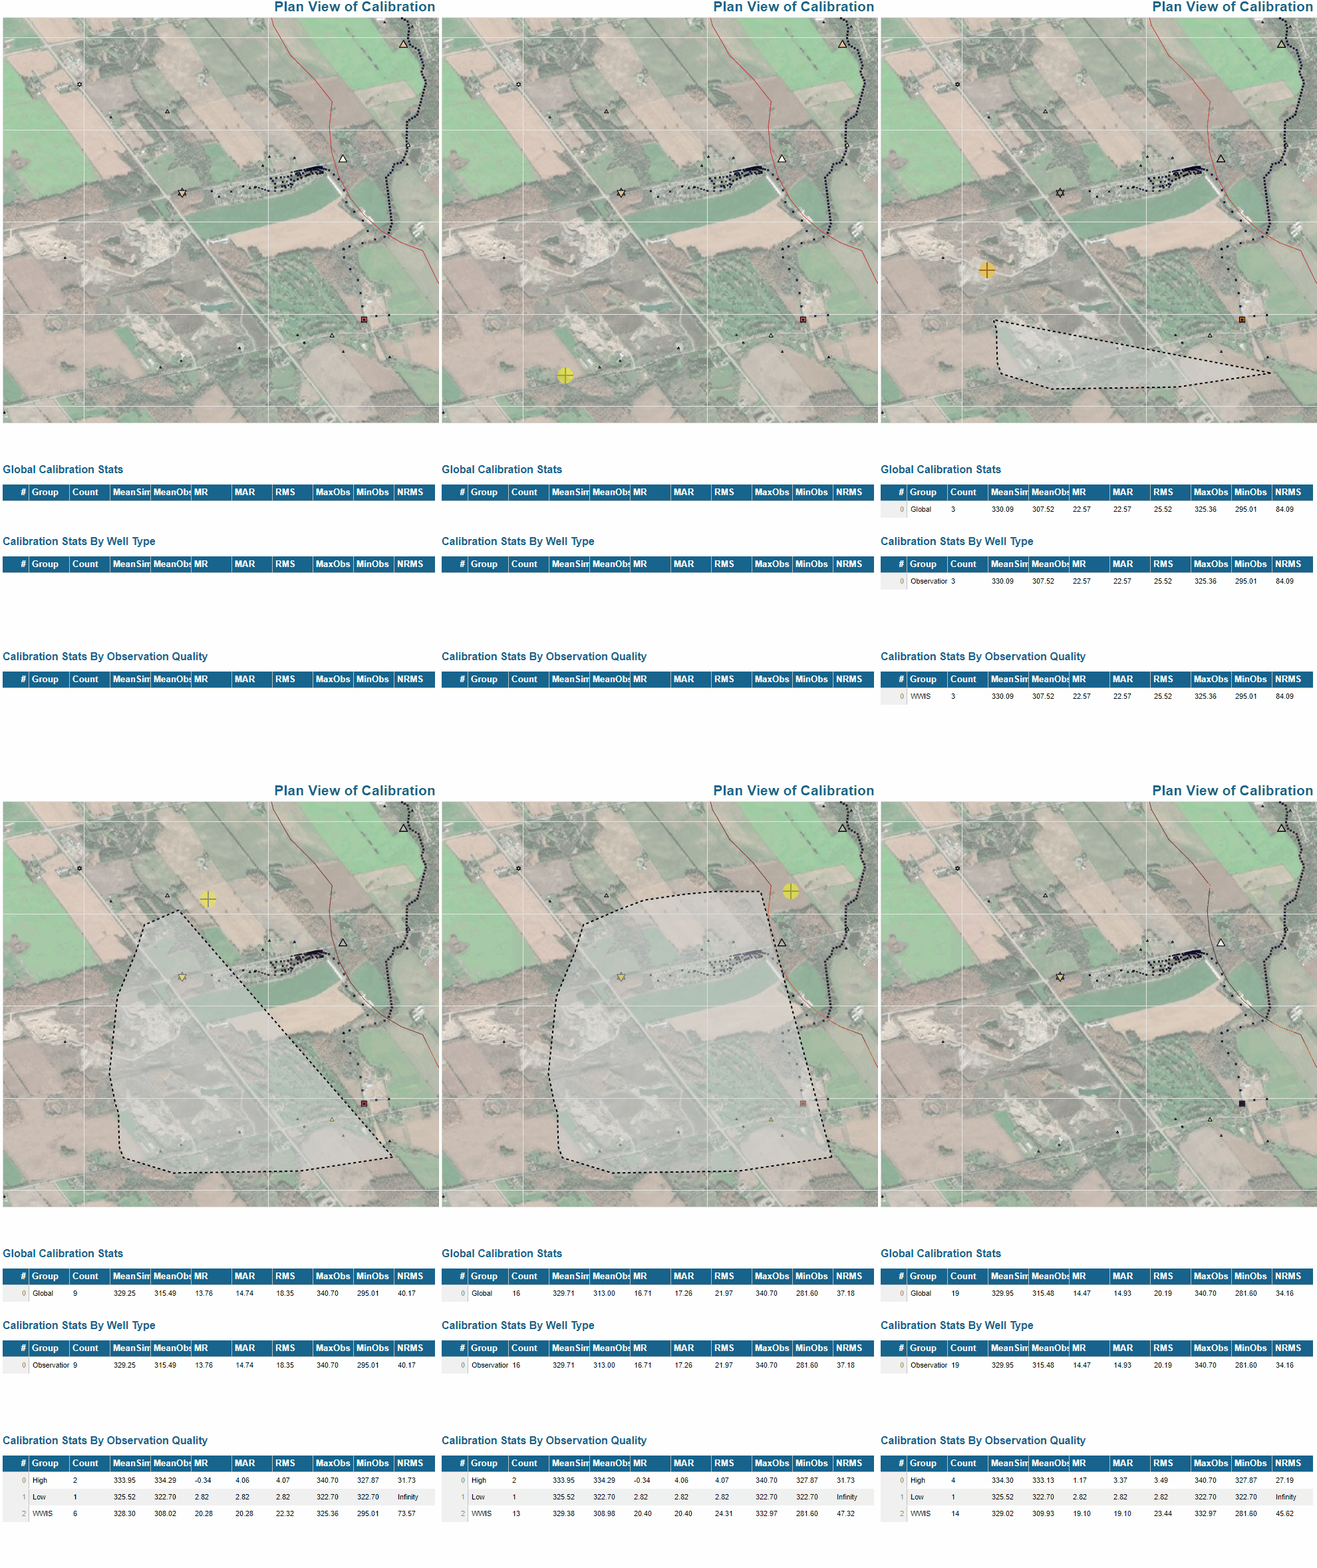
I did this with d3 because the aggregation functions are custom, i.e. not just “AVG” “COUNT” etc. It took a fair bit of work and learning but payoff was worth it  Good luck!




 , that’s why I suggested trying alasql which would let you basically write basic SQL directly in the callback.
