
☰Read-only archive⌕
Looking for help with Bokeh?

This is a read-only archive. Ask questions and join the conversation on GitHub.

Visit Community Support on GitHub →
Archived discussions · Captured October 28, 2026

How to control axis position/ alignment

Community Support
grzegorz.malinowski
grzegorz.malinowski

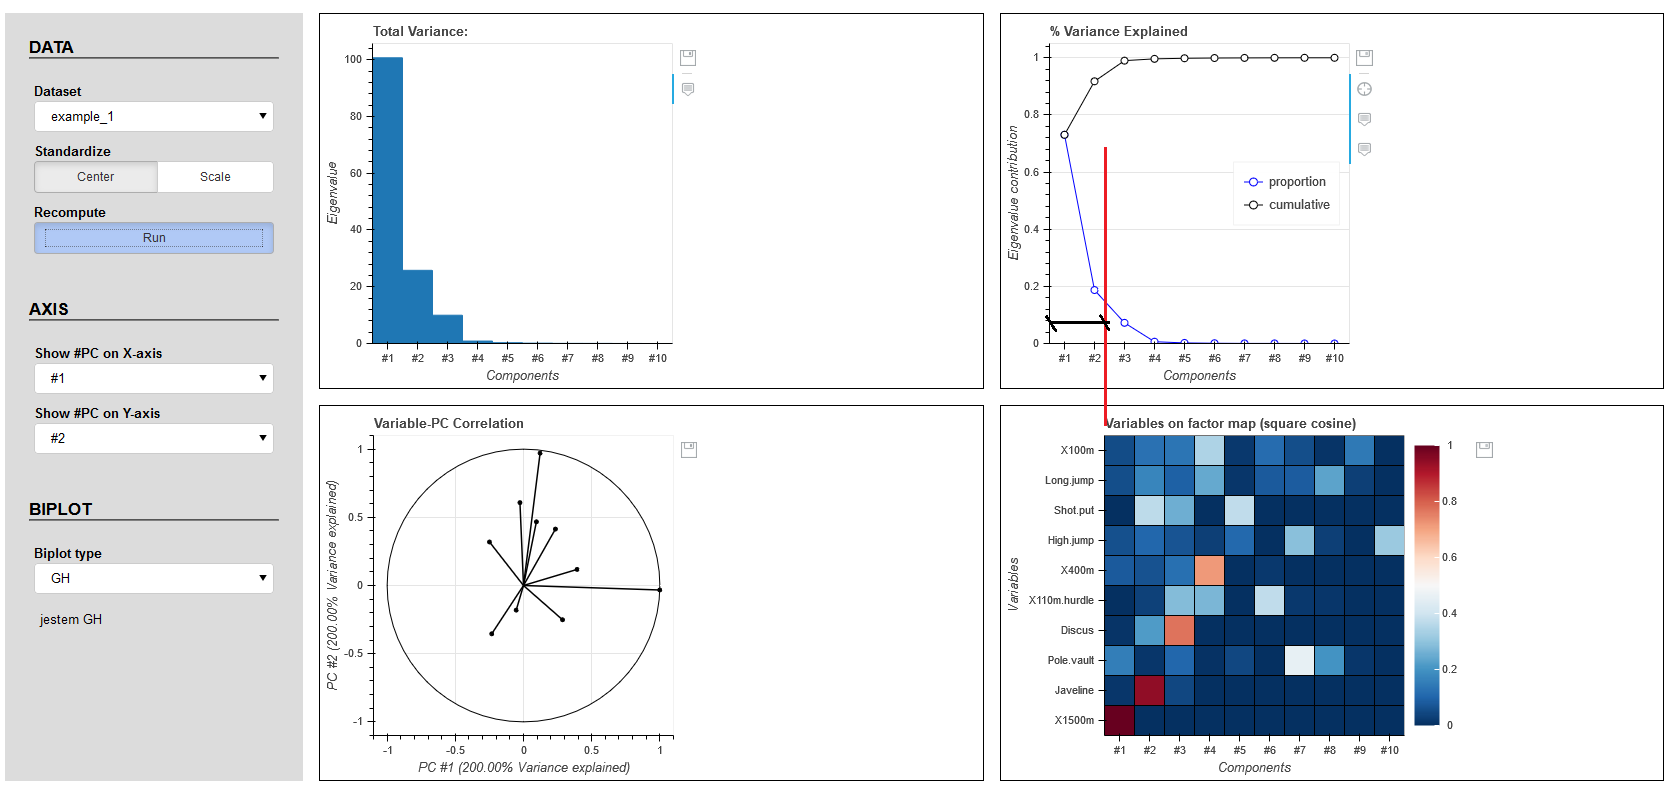
I’m looking for the solution as in the title. This is not Bokeh layout (gridplot). I’d appreciate any kind of help how to get an set the axis position when labels have not fixed length. The below code represents all plots’ settings.

def plot_contribution(name = 'p_contribution'):
    p = figure(frame_width=300, frame_height=300, match_aspect=False)
    return p

plot_2 = plot_contribution()
curdoc().add_root(plot_2)

⌁   Link to post
p-himik
p-himik

Is there any particular reason for not using gridplot? Because this sort of problem is exactly what it tries to solve.

Solving it on your own would require a substantial amount of JS code and a deep understanding of Bokeh layout system.

⌁   Link to post
Bryan
Bryan

I’m afraid it is the best solution available, if you can’t use a gridplot with a vertical arrangement of plots.

⌁   Link to post
Bryan
Bryan

In terms of things that don’t yet exist yet, some things that might be reasonable to explore for future development:

  • an actual model for border padding that could shared between plots so that when updates so does the other
  • events for border padding changes so that JS callbacks could twiddle min_padding values if desired

Please feel free to open a GH issue to discuss any of these (or other) ideas

⌁   Link to post

End of archived discussion · Replies are disabled

