
☰Read-only archive⌕
Looking for help with Bokeh?

This is a read-only archive. Ask questions and join the conversation on GitHub.

Visit Community Support on GitHub →
Archived discussions · Captured October 28, 2026

How to create a callback executed when a curve is turned off in legends

Community Supporthoverserver
mpplotit
mpplotit

I have the next application my_app.py:

import numpy as np
import holoviews as hv
from bokeh.io import curdoc
from bokeh.layouts import layout
from bokeh.models import HoverTool
hv.extension(‘bokeh’)
renderer = hv.renderer(‘bokeh’).instance(mode=‘server’)

frequencies = [0.5, 1.0]

def sine_curve(phase, freq):
xvals = [0.1* i for i in range(100)]
return hv.Curve((xvals, [np.sin(phase+freq*x) for x in xvals]))

def callback1():
print(‘Curve “0.5” is turn off’)
def callback2():
print(‘Curve “0.5” is turn on’)
curve_dict = {f:sine_curve(0,f) for f in frequencies}

ndoverlay = hv.NdOverlay(curve_dict, kdims=‘frequency’)
doc=curdoc()
hvplot = renderer.get_plot(ndoverlay, doc)
plot=layout(hvplot.state)
doc.add_root(plot)

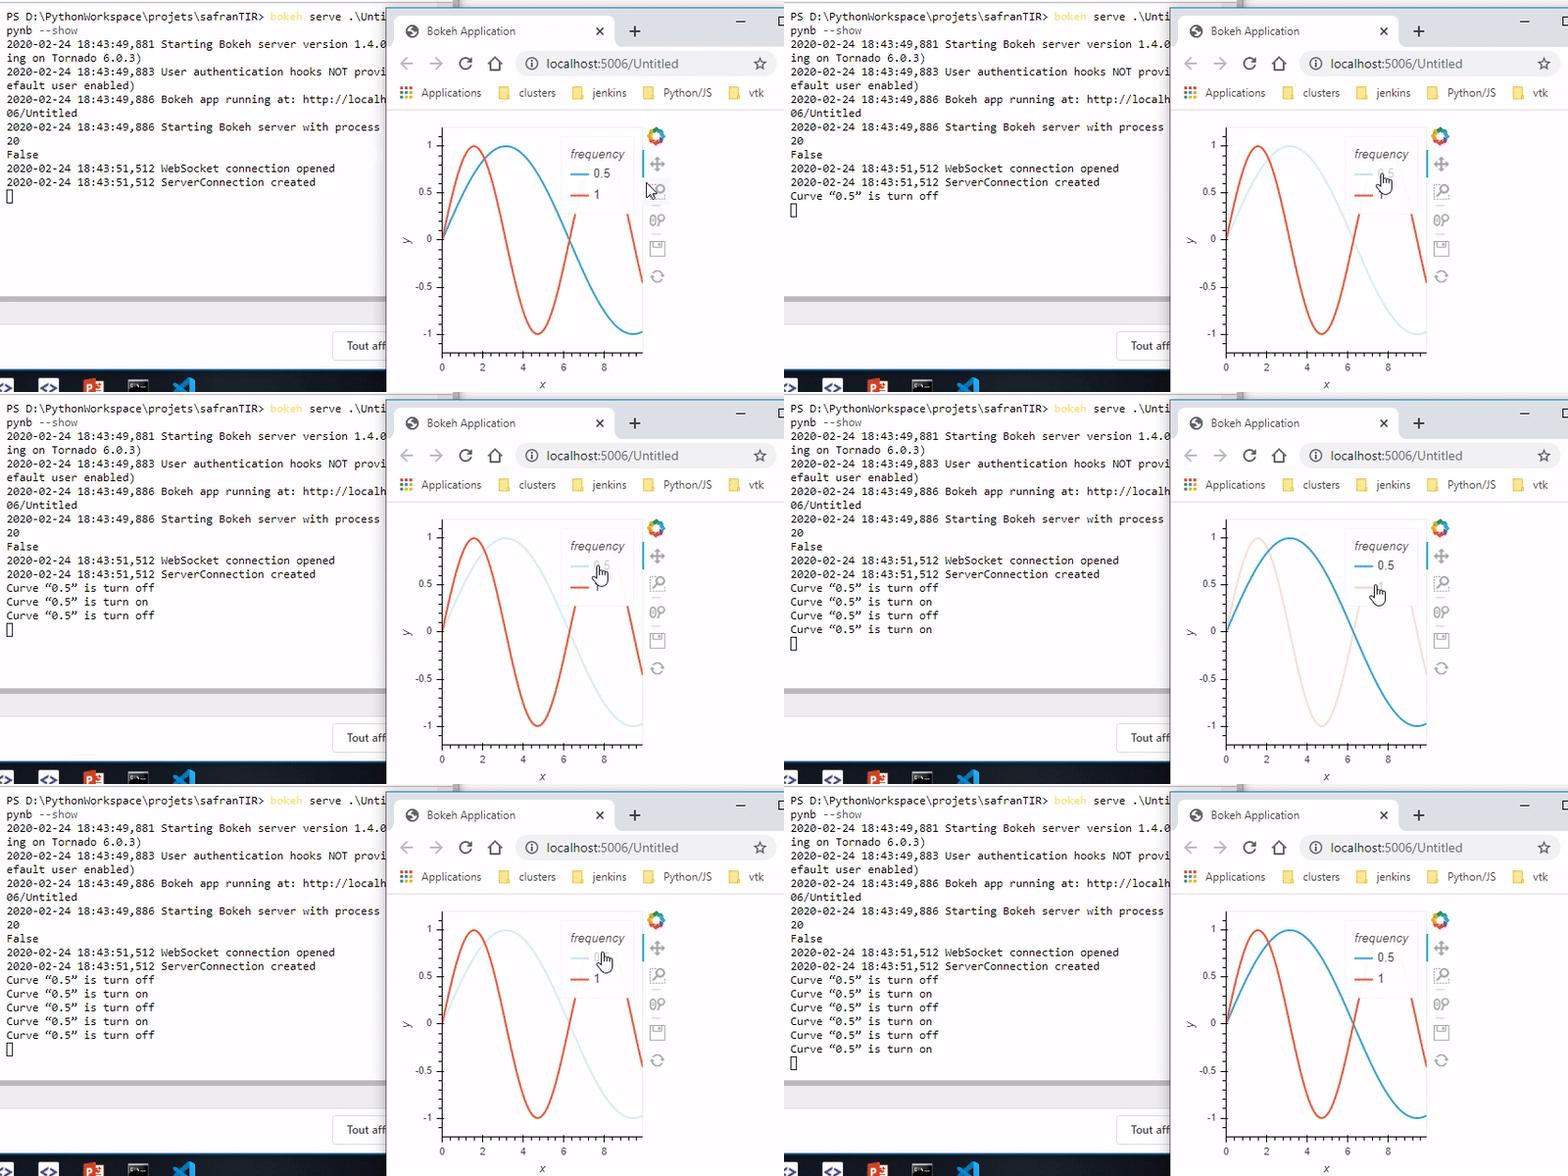
I need to make sure that when you turn off the curve “0.5” in the legend, the callback1 () function is called, and when you turn on the curve “0.5” callback2 () function is called.
How to implement this?

⌁   Link to post
Xavier_Artusi
Xavier_Artusi

I don’t know if it’s a bokeh or a holoview question but
something like that should do the trick:

import numpy as np
import holoviews as hv
from bokeh.io import curdoc
from bokeh.layouts import layout
from bokeh.models import HoverTool
hv.extension('bokeh')
renderer = hv.renderer('bokeh').instance(mode='server')

frequencies = [0.5, 1.0]
def callback(attr,old,new):
    if new:
        print('Curve “0.5” is turn off')
    else:
        print('Curve “0.5” is turn on')
    
def sine_curve(phase, freq):
    xvals = [0.1* i for i in range(100)]
    return hv.Curve((xvals, [np.sin(phase+freq*x) for x in xvals]))

curve_dict = {f:sine_curve(0,f) for f in frequencies}

ndoverlay = hv.NdOverlay(curve_dict, kdims='frequency')
doc=curdoc()
hvplot = renderer.get_plot(ndoverlay, doc)
legend_items = hvplot.handles['legend_items']
for li in legend_items:
    if li.label['value'] == '0.5':
        li.renderers[0].on_change('muted',callback)

plot=layout(hvplot.state)
doc.add_root(plot)

⌁   Link to post
p-himik
p-himik

Beat me to it. :smiley: Here’s my solution - a bit more generic and removes the unnecessary call to layout:

import holoviews as hv
import numpy as np

from bokeh.io import curdoc

hv.extension('bokeh')
renderer = hv.renderer('bokeh').instance(mode='server')

frequencies = [0.5, 1.0]


def sine_curve(phase, freq):
    xvals = [0.1 * i for i in range(100)]
    return hv.Curve((xvals, [np.sin(phase + freq * x) for x in xvals]), name=str(freq))


def callback1():
    print('Curve "0.5" is turn off')


def callback2():
    print('Curve "0.5" is turn on')


curve_dict = {f: sine_curve(0, f) for f in frequencies}

ndoverlay = hv.NdOverlay(curve_dict, kdims='frequency')
doc = curdoc()
plot = renderer.get_plot(ndoverlay, doc).state


def find_and_attach_to_legend(legend, label):
    for i in legend.items:
        if i.label['value'] == label:
            if legend.click_policy == 'hide':
                attr = 'visible'
                invert = False
            elif legend.click_policy == 'mute':
                attr = 'muted'
                invert = True
            else:
                raise RuntimeError('Unhandled click_policy value', legend.click_policy)

            def on_visible_change(attr, old, new):
                if invert:
                    new = not new
                if new:
                    callback2()
                else:
                    callback1()

            i.renderers[0].on_change(attr, on_visible_change)
            break


find_and_attach_to_legend(plot.legend, '0.5')

doc.add_root(plot)
⌁   Link to post

End of archived discussion · Replies are disabled
