

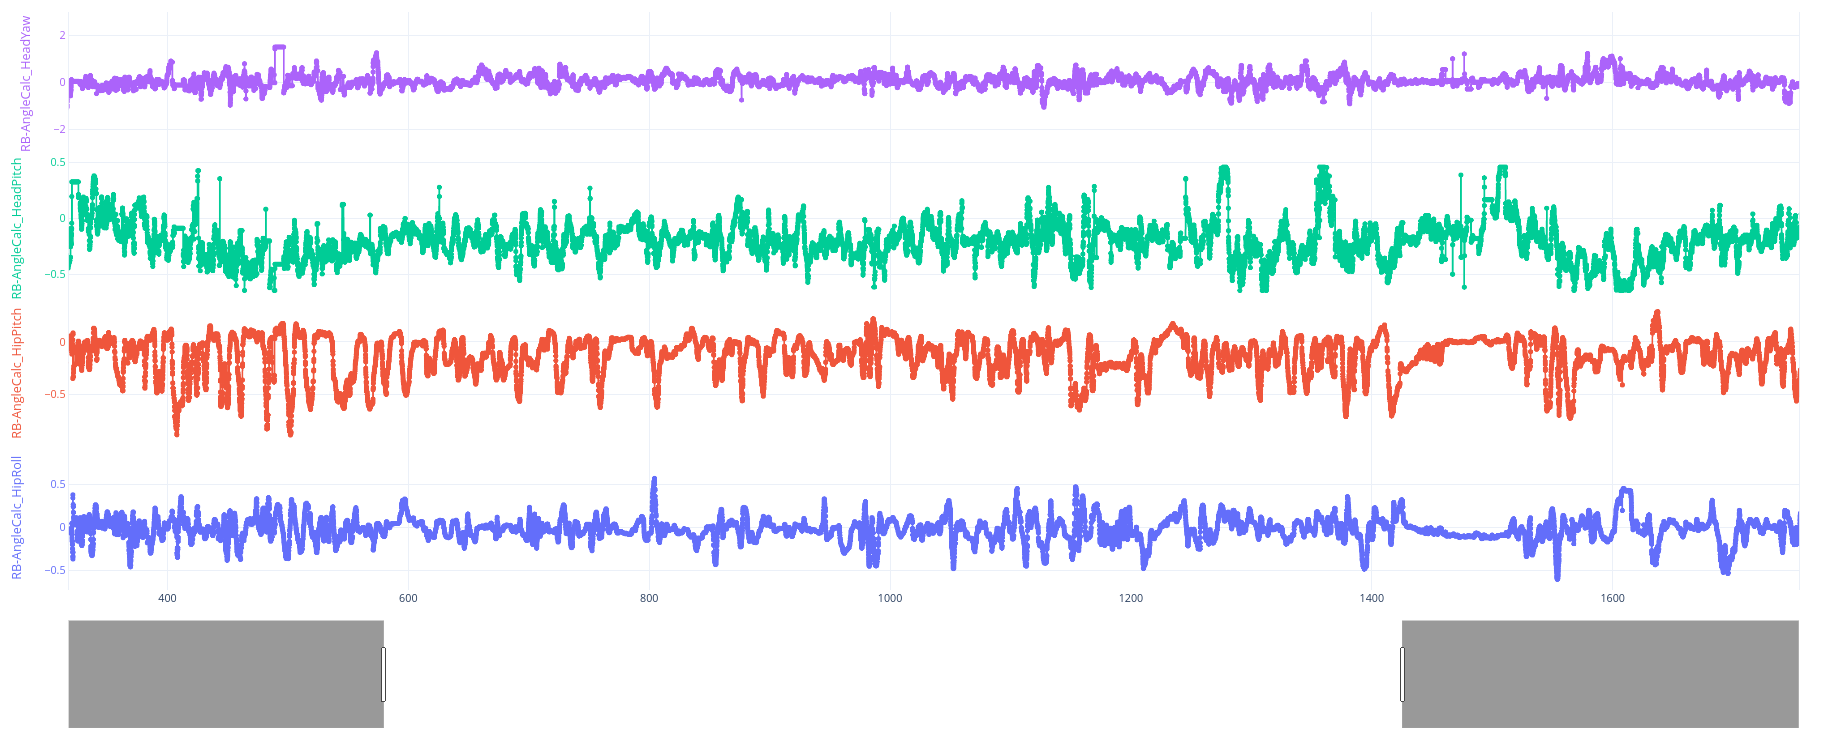
I am considering moving from the Plotly ecosystem to Bokeh/Holoviews but one requirement is that it should be possible to plot several time series in “stacked” view, where all the time series share the x-axis, and a range slider, but have their own y-axis.
Here is an image that illustrates what this looks like:
Is it possible to do this?
I would need to be able to have this plot interact with the bokeh/panel server so that a callback gets invoked whenever the plot is scrolled/zoomed or whenever a range is selected.

