

Hi,
I would like to recreate a charting behavior happening from here: Date Boris Johnson Leaves UK PM Office | Metaculus
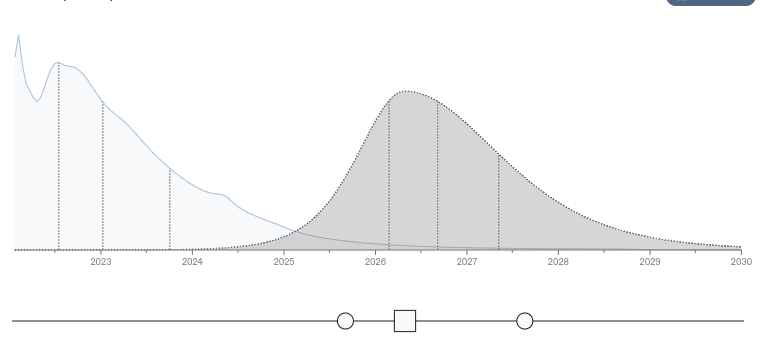
I think I will use some server-side updatesto compute the probability distribution (line with a shaded area) based on the position of sliders. But the blocker I have is that I am not sure how to render those “3 sliders” (circles change the shape, while square moves the center) while being able to listen on their events.
is the way to somehow implement it via my own Slider component? Could someone give me a hint how to do it, please?


