

My data is like
| product_id | sale_count | yhat | pred_count | ape1 | ape2 | acc1 | acc2 | product_name | product_code |
|---|---|---|---|---|---|---|---|---|---|
| 08aa39d5-97a8-4367-a90c-29cab50f4121 | 17442 | 19112.0 | 18167.1 | 0.04157 | 0.09575 | 95.84 | 90.43 | 银祥日本豆腐 | 2000444 |
tooltips:
tooltips=[
    ('acc', '@acc2%'),('name', '@product_name'), ('code', '@product_code'), ('id', '@product_id'),('sc', '@sale_count'), ('pc', '@yhat')], )
Some points plot normal number/float , but some are not, like this :
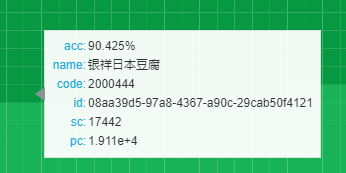
Directly print this dataframe would not show scientific notation too, why bokeh burn daylight ?

