On Aug 1, 2018, at 20:30, Daniel <[email protected]> wrote:
I've moved on and intend on using pyviz visualization library (http://pyviz.org/\). It has hvplot() function which allows you to make bokeh plots directly from pandas dataframe. Check out https://www.youtube.com/watch?v=aZ1G_Q7ovmc&list=PLYx7XA2nY5Gd-tNhm79CNMe_qvi35PgUR skip to about 20 minutes.
On Wednesday, August 1, 2018 at 11:16:49 PM UTC-4, cristian...@king.com wrote:
Hi Brian, I'm trying to do exactly what the original question was asking. Get the name of the series/column to show up with the hover tool.
I also tried using updated code from the bokeh gallery Interactive legends — Bokeh 3.3.2 Documentation
but alas same result. Here is what I have thus far using the example code from the gallery, again I can't include the series name in the hover tool.
from bokeh.palettes import Spectral4
from bokeh.models import HoverTool
from bokeh.plotting import figure, output_file, show
from bokeh.sampledata.stocks import AAPL, IBM, MSFT, GOOG
p = figure(plot_width=800, plot_height=400, x_axis_type="datetime", tools='hover,save',logo=None)
p.title.text = 'Click on legend entries to hide the corresponding lines'
for data, name, color in zip([AAPL, IBM, MSFT, GOOG], ["AAPL", "IBM", "MSFT", "GOOG"], Spectral4):
df = pd.DataFrame(data)
df['date'] = pd.to_datetime(df['date'])
p.line(x=df['date'], y=df['close'], color=color, alpha=0.8, legend=name)
# format tooltips
hover = p.select(dict(type=HoverTool))
hover.tooltips = [("Stock", "name"\), \("Date", "@x\{%F\}"\), \("Close", "@{y}{0.2f}")]
hover.formatters={'x': 'datetime'}
hover.mode = 'mouse'
p.legend.location = "top_left"
p.legend.click_policy="hide"
output_file("interactive_legend.html", title="interactive_legend.py example")
show(p)
Ultimately, I would like to be able to pass a time series dataframe and have the columns serve as labels.
On Wednesday, August 1, 2018 at 8:10:01 PM UTC-7, Bryan Van de ven wrote:
This change happened years ago. I tried to make the error message self-contained and immediately actionable as to how to update old (now very old) code that mixed CDS column references and literal lists in glyph functions. Can you describe what is unclear about the directions in this exception message so I can try to improve it? The goal is that users can take action immediately without needing to resort to help forums.
Thanks,
Bryan
> On Aug 1, 2018, at 20:06, cristian...@king.com wrote:
>
>
> Has this method been updated? I've repeated the code here receive the error:
> Supplying a user-defined data source AND iterable values to glyph methods is
> not possibe. Either:
>
> Pass all data directly as literals:
>
> p.circe(x=a_list, y=an_array, ...)
>
> Or, put all data in a ColumnDataSource and pass column names:
>
> source = ColumnDataSource(data=dict(x=a_list, y=an_array))
> p.circe(x='x', y='y', source=source, ...)
>
> On Monday, April 25, 2016 at 8:50:24 AM UTC-7, Daniel wrote:
> Hello,
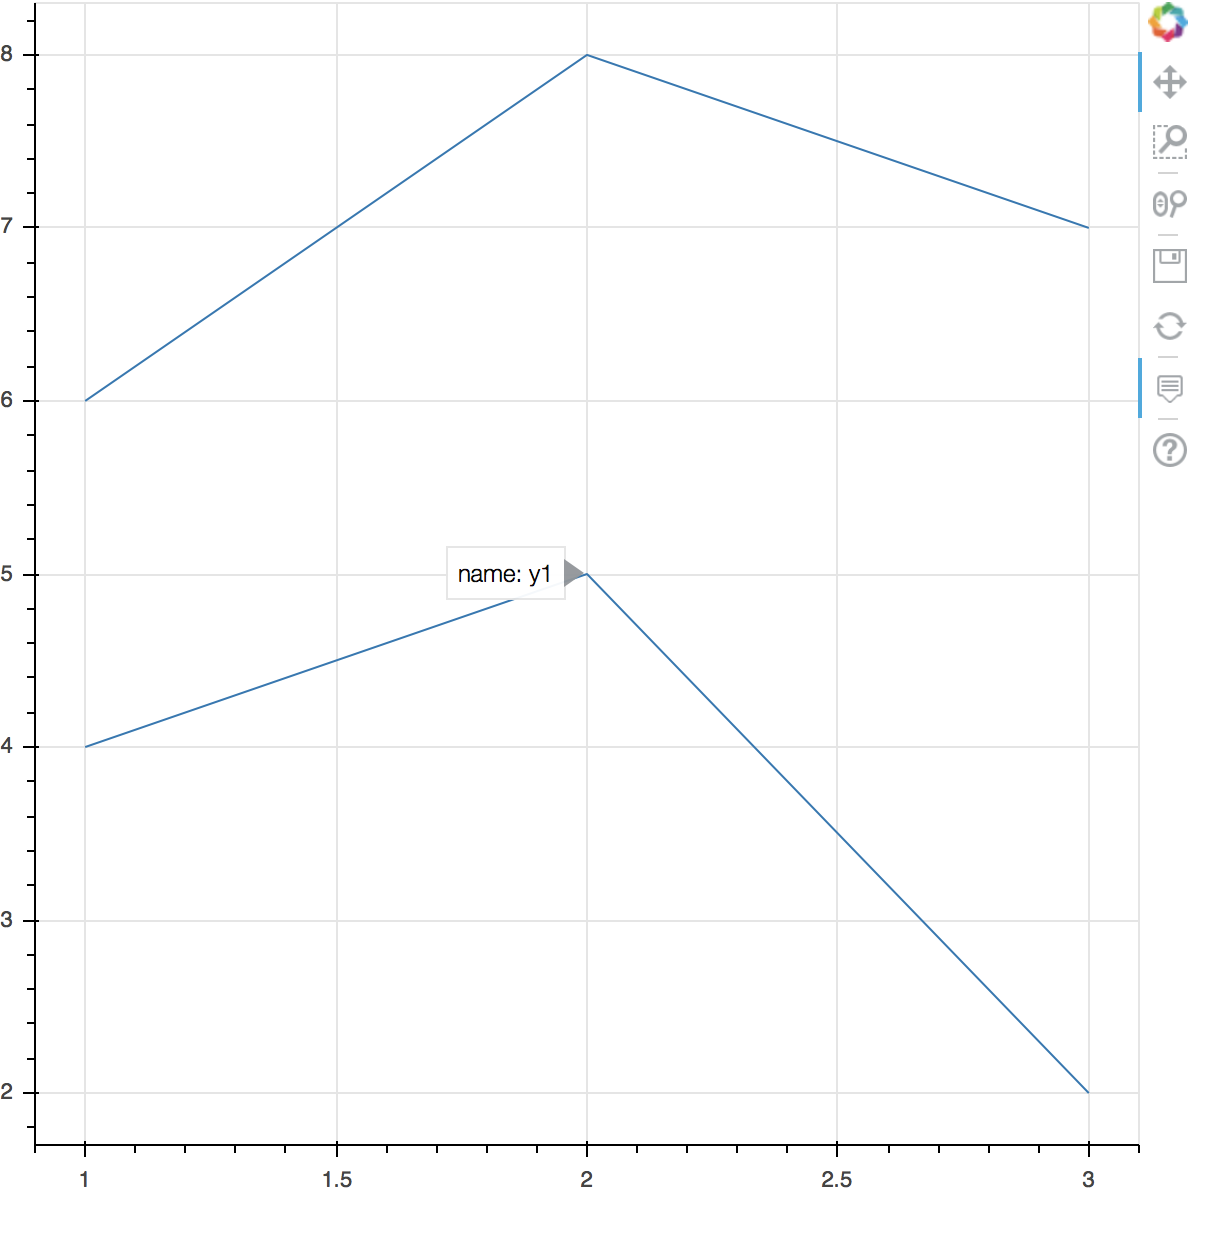
> I would like to be able to identify individual chart series with the hover tool. I want the column name/series name to show up on the hover tool. I looked at the documentation, but I couldn't find any that shows how to work with dataframe.
>
> Here's what I have so far:
> Bokeh dataframe hover example · GitHub
>
> Thanks in advance!
>
> - Daniel
>
> --
> You received this message because you are subscribed to the Google Groups "Bokeh Discussion - Public" group.
> To unsubscribe from this group and stop receiving emails from it, send an email to bokeh+un...@continuum.io.
> To post to this group, send email to bo...@continuum.io.
> To view this discussion on the web visit https://groups.google.com/a/continuum.io/d/msgid/bokeh/46933468-fd06-4335-b930-c5c15563a6c1%40continuum.io\.
> For more options, visit https://groups.google.com/a/continuum.io/d/optout\.
--
You received this message because you are subscribed to the Google Groups "Bokeh Discussion - Public" group.
To unsubscribe from this group and stop receiving emails from it, send an email to [email protected].
To post to this group, send email to [email protected].
To view this discussion on the web visit https://groups.google.com/a/continuum.io/d/msgid/bokeh/11b11c8a-0b50-4eb9-9280-6c16bed4ca6b%40continuum.io\.
For more options, visit https://groups.google.com/a/continuum.io/d/optout\.