

When adding a legend outside the plot area, the length of the axis is automatically reduced to fit the legend. I would like to expand the figure width so that the length of the axis stays the same as without the added layout. This would be relatively straightforward if I could retrieve the current width of the either the axis or the added layout/legend, but I can’t figure out how to do that.
Example where I would like the plot section of each figure to be as wide, currently the rightmost figure looks compressed horizontally:
from bokeh.layouts import gridplot
from bokeh.models import CategoricalColorMapper, Legend
from bokeh.palettes import Category10
from bokeh.plotting import figure, show
from bokeh.sampledata.iris import flowers


color_mapper = CategoricalColorMapper(
    factors=[x for x in flowers['species'].unique()], palette=Category10[10])

p1 = figure(height=350, width=350)
p1.circle("petal_length", "sepal_length", source=flowers,
          color=dict(field='species', transform=color_mapper))

p2 = figure(height=350, width=350)
p2.add_layout(Legend(), 'right')
p2.circle("petal_length", "petal_width", source=flowers, legend_group='species',
         color=dict(field='species', transform=color_mapper))

show(gridplot([p1, p2], ncols=2))
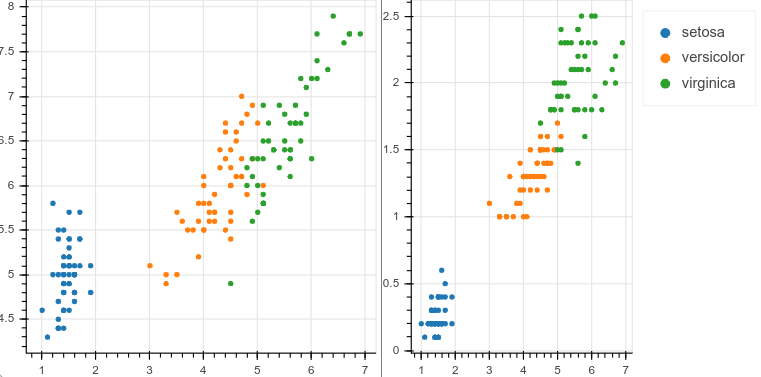
In my actual code, the legend label length will change so I can’t just optimize the value once manually, it needs to adapt to the actual width of the legend. The only semi-solution I can think of right now is to count the characters in the text labels and expand the figure with a set amount per character, but this will be imperfect since different characters have different width. Is there a more elegant solution?

