☰Read-only archive⌕
Looking for help with Bokeh?

This is a read-only archive. Ask questions and join the conversation on GitHub.

Visit Community Support on GitHub →
Archived discussions · Captured October 28, 2026

How to plot a range using ColumnDataSource?

Community Supportbokehjs
nagmat1
nagmat1

I am trying to plot a big graph. I want to plot a range in X_axis. Below you can find what I am trying to do, which I made using matplotlib.

import matplotlib.pyplot as plt
import csv

with open('test.csv','r') as csvfile :
    rows = list(csv.reader(csvfile, delimiter=','))[1:]
    rows.sort(key = lambda x: int(x[1])) 
    for row in rows:
        start, end, data = int(row[2]), int(row[3]), int(row[1])
        x = [start, end]
        y = [data, data]
        plt.plot(x, y, color = 'b', marker='o')
plt.xlabel('time(milliseconds)')
plt.ylabel('Amount of Data(bytes)')
plt.title('VFS layer Read only graph')
plt.grid(True)
plt.savefig('VR.png')
plt.show()
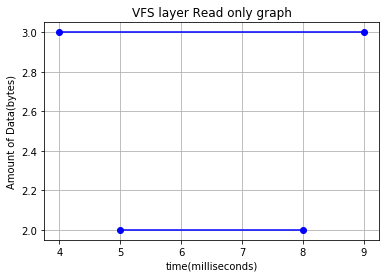
image
This is the image result for the plot using matplotlib. I want to do the same using Bokeh ColumnDataSource.

df = pd.read_csv('test.csv')

data = ColumnDataSource(data={
    'x':df['x'],
    **'y':df['y1']+df['y2'],** # I could not give range in here
})
plot1 = figure()
plot1.cross(x='x',y='y',source=data, color='red', size=10, alpha=0.8)
plot2 = figure()
output_file('First_try.html')
show(plot1)

How can I give a range in ColumnDataSource?

⌁   Link to post
nagmat1
nagmat1
df = pd.read_csv('test.csv')
print(df)
data = ColumnDataSource(data={
    'x':df['x'],
    'y1':df['y1'],
    'y2':df['y2'],
})
plot1 = figure()
plot1.segment(x0='x', y0='y1', x1='x',y1='y2', color="#F4A582", line_width=3)
output_file('First_try.html')
show(plot1)

I have changed the code as you said, but it is giving error

ERROR:bokeh.core.validation.check:E-1001 (BAD_COLUMN_NAME): Glyph refers to nonexistent column name. This could either be due to a misspelling or typo, or due to an expected column being missing. : key "x0" value "x", key "x1" value "x", key "y0" value "y1", key "y1" value "y2" [renderer: GlyphRenderer(id='6297', ...)]

This is the csv file :
id x y1 y2
0 1 2 5 8
1 2 3 4 9

⌁   Link to post
nagmat1
nagmat1

Sorry, I forgot to put the source :

df = pd.read_csv('test.csv')
print(df)
data = ColumnDataSource(data={
    'x1':df['x1'],
    'x2':df['x2'],
    'y':df['y'],
})
plot1 = figure(plot_width=400, plot_height=400)
plot1.segment(x0='x1', y0='y', x1='x2',y1='y', color="red", line_width=3,**source=data**)
output_file('First_try.html')
show(plot1)
⌁   Link to post
nagmat1
nagmat1


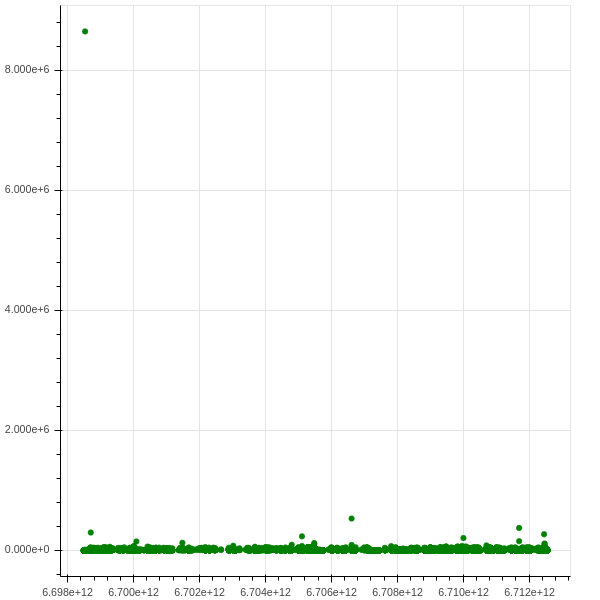
This is the result of plot using plot1.circle, but plot1.segment is not printing anything.

df = pd.read_csv('syscall.csv')
print(df)
data = ColumnDataSource(data={
    'x1':df['subm_syscall_ts'],
    'x2':df['comp_syscall_ts'],
    'y':df['lat'],
})
plot1 = figure()
plot1.segment(x0='x1',y0='y',x1='x2',y1='y',source=data, color='red',alpha=1)
plot1.circle(x='x1',y='y',color='green',size=5,source=data)
output_file('segment.html')
show(plot1)

The syscall.csv contains 218k lines of information regarding input/output of ssd(solid state drive). Why plot1.segment is not printing anything?

⌁   Link to post
p-himik
p-himik

Most likely either it’s your data or your scale - the segments could be shorter than the size of the circles.
This works just fine:

from bokeh.io import show
from bokeh.models import ColumnDataSource
from bokeh.plotting import figure

data = ColumnDataSource(data={
    'x1': [1, 2, 3],
    'x2': [2, 3, 5],
    'y': [0, 1, 2],
})
p = figure()
p.segment(x0='x1', y0='y', x1='x2', y1='y', source=data, color='red', alpha=1)
p.circle(x='x1', y='y', color='green', size=5, source=data)

show(p)
⌁   Link to post
nagmat1
nagmat1

I think there is a limitation for segment while there isn’t for circle. It is working fine when I executed with 5 lines of information for segment but with 30 lines it is not drawing anythin.

⌁   Link to post
Bryan
Bryan

There is no limitation anywhere close to that small. Here is an example that plots 2500 segments:

⌁   Link to post

End of archived discussion · Replies are disabled