On Aug 31, 2017, at 10:22, Nikoloz Mamisashvili <nikusha37@gmail.com> wrote:
from bokeh.plotting import figure, output_file, show

output_file("border.html")

p = figure(plot_width=400, plot_height=400)
p.border_fill_color = "whitesmoke"
p.min_border_left = 80

p.circle([1,2,3,4,5], [2,5,8,2,7], size=10)

show(p)
<bokeh_plot.png>
May be this will help?
On Thu, Aug 31, 2017 at 6:56 PM, Sébastien Roche <sebastienroche11@gmail.com> wrote:
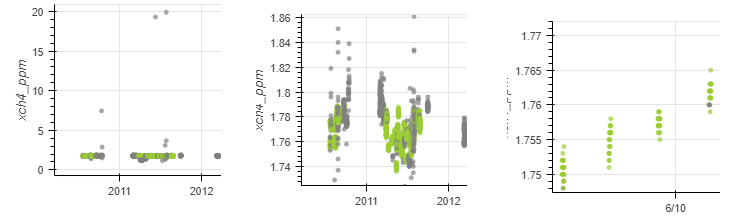
After updating the axis ranges of a plot with labels, the labels gets clipped by the egde of the canvas.
This happens when I zoom in and the precision of the numbers on the axis grows (so the strings get longer and 'push' the label in the edge), I attached a picture of the same plot with different zooms.
This also happen when I push new data to a source, but this is fixed when I use the 'Reset' button which changes the actual plot area to fit everything.
What should I do to resize the plot area like the Reset button does, but without resetting the axis ranges?
--
You received this message because you are subscribed to the Google Groups "Bokeh Discussion - Public" group.
To unsubscribe from this group and stop receiving emails from it, send an email to bokeh+unsubscribe@continuum.io.
To post to this group, send email to bokeh@continuum.io.
To view this discussion on the web visit https://groups.google.com/a/continuum.io/d/msgid/bokeh/86cd31c0-790b-4230-a8de-deca66fd15b4%40continuum.io\.
For more options, visit https://groups.google.com/a/continuum.io/d/optout\.
--
You received this message because you are subscribed to the Google Groups "Bokeh Discussion - Public" group.
To unsubscribe from this group and stop receiving emails from it, send an email to bokeh+unsubscribe@continuum.io.
To post to this group, send email to bokeh@continuum.io.
To view this discussion on the web visit https://groups.google.com/a/continuum.io/d/msgid/bokeh/CAFo3QZRcWYKry7Y7TmaKxH0hf5pvj4qPW0U1Q%2BjD9orGegJemQ%40mail.gmail.com\.
For more options, visit https://groups.google.com/a/continuum.io/d/optout\.