How to resize layout when title/range is changed

What are you trying to do?

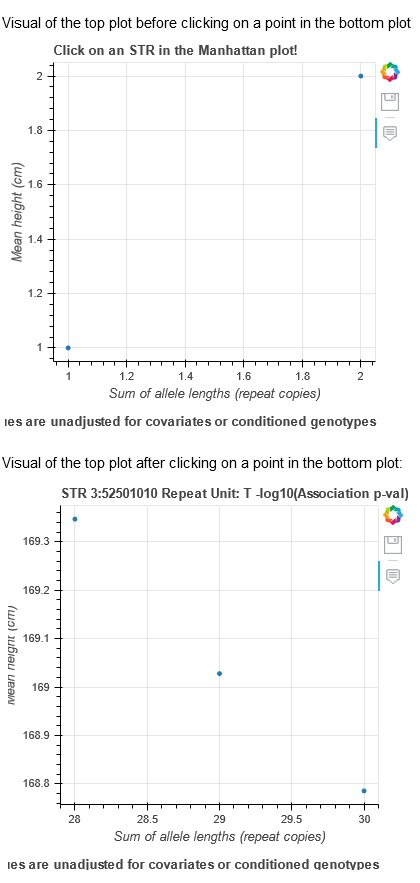
I have a static html bokeh page generated by a python script that embeds some javascript. In it there are two plots in a column layout. Clicking on a point on the bottom plot causes the top plot to be populated with some information associated with that point.

What have you tried that did NOT work as expected?

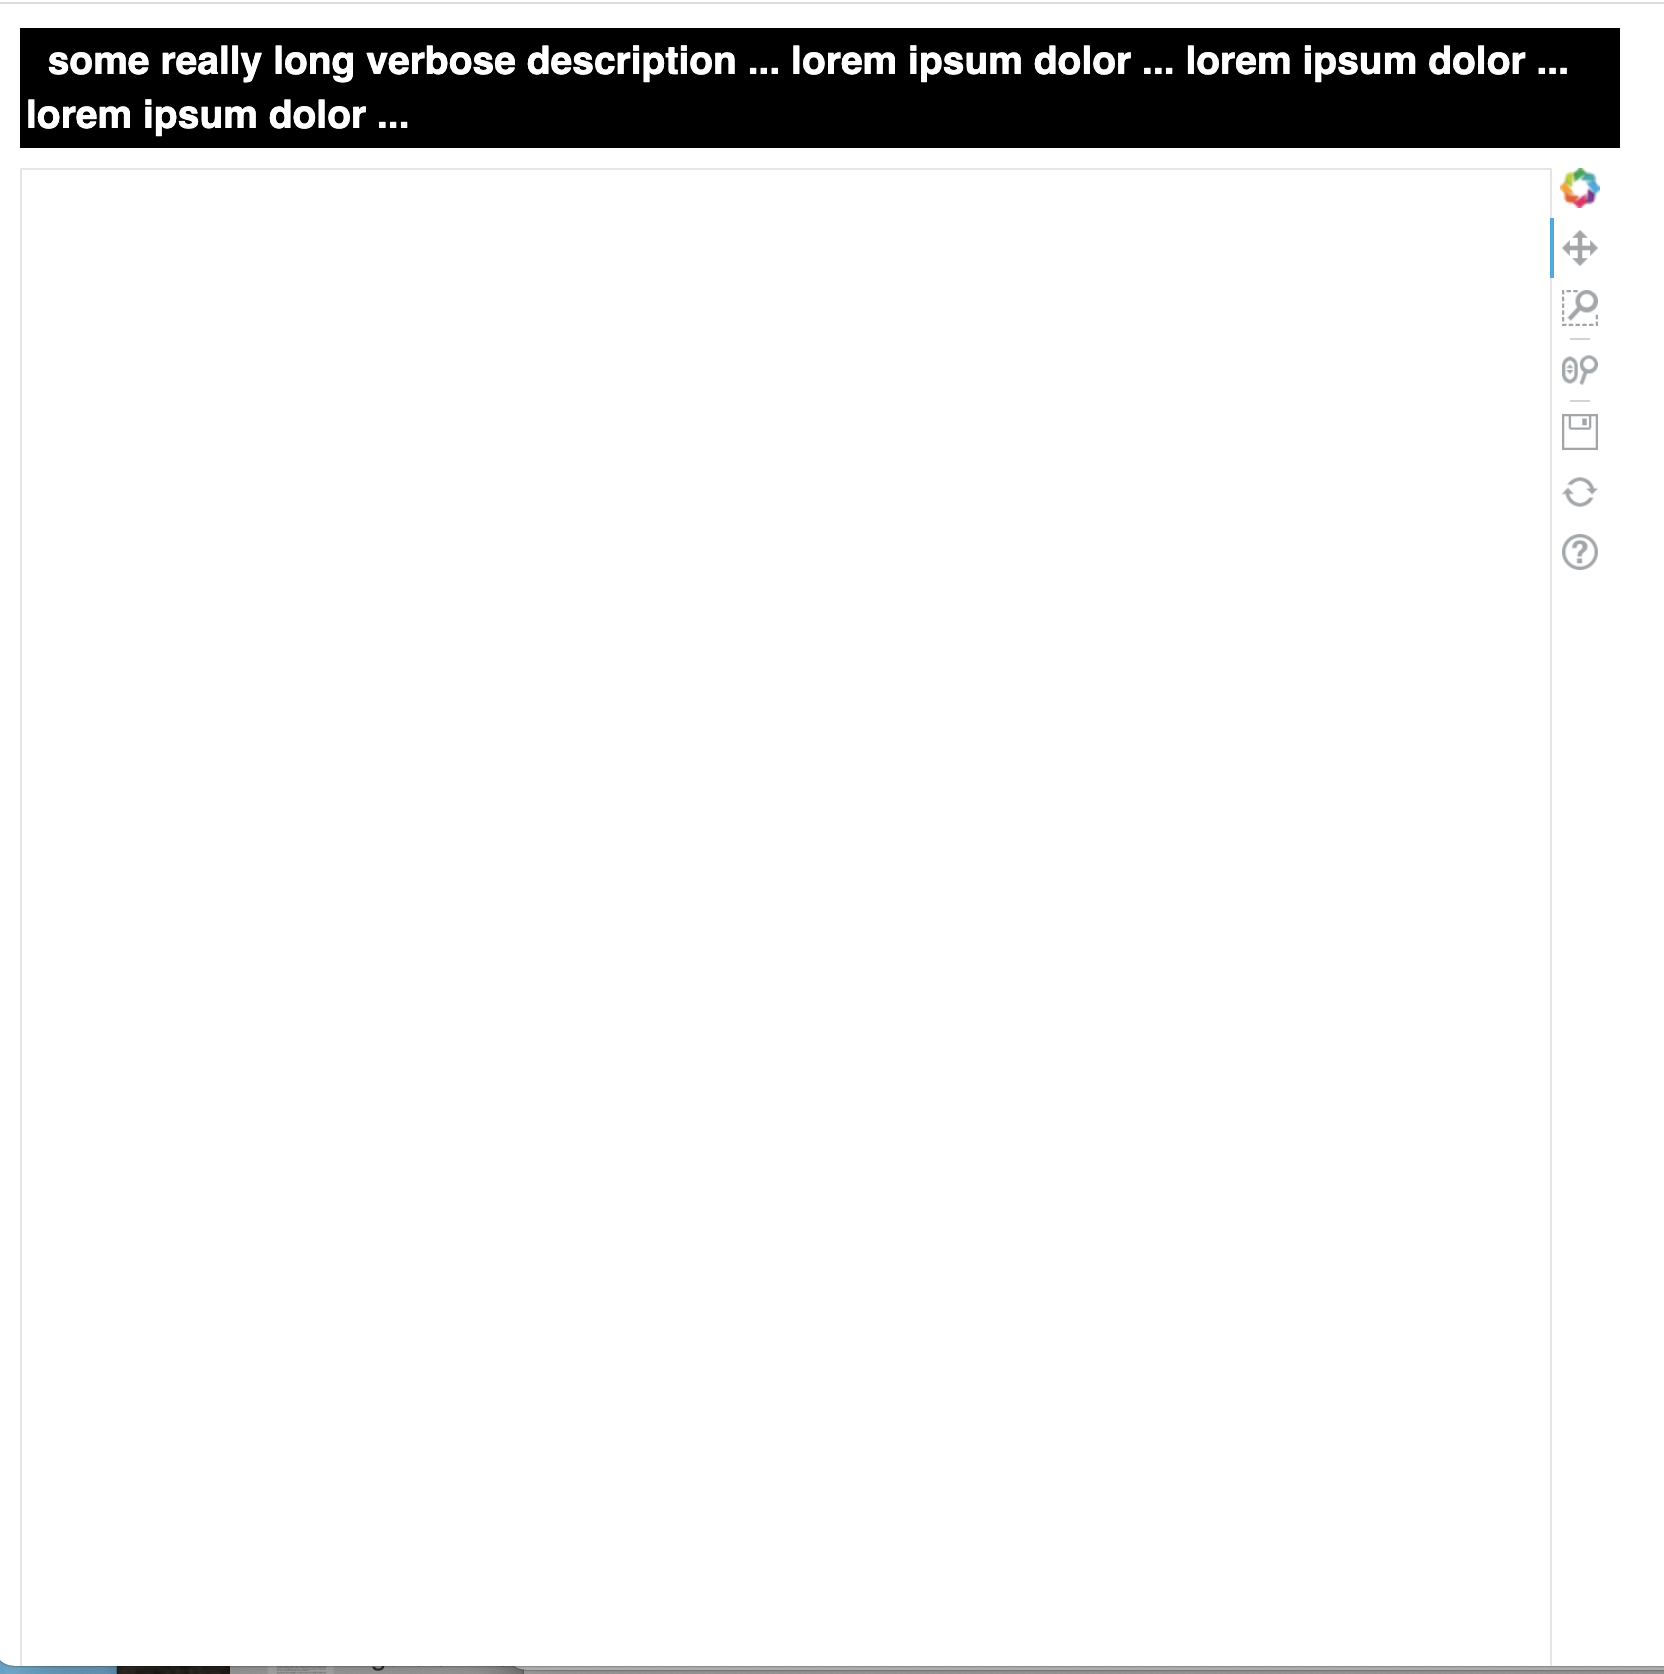
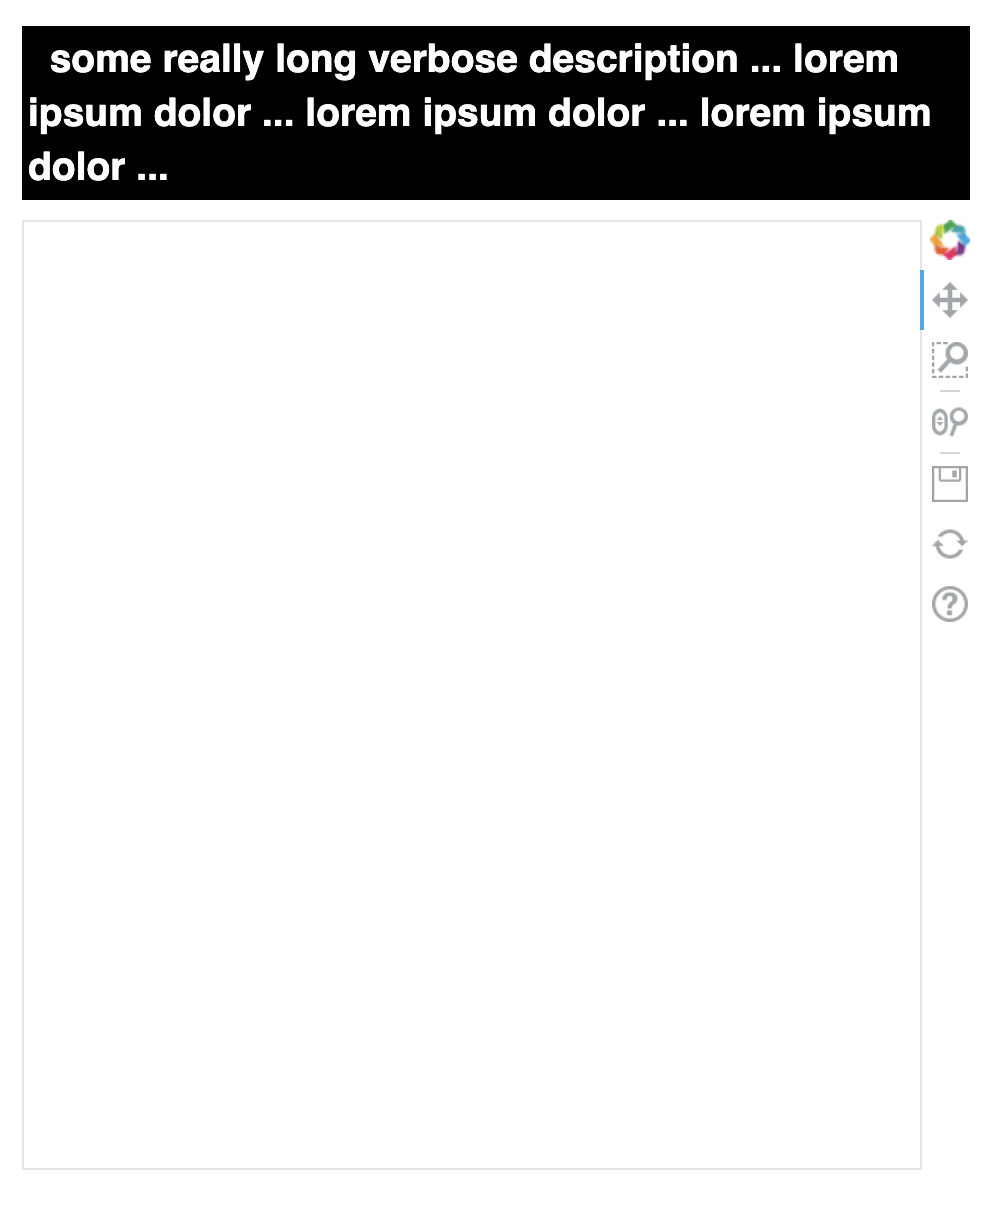
In both pics the text on the bottom is cut off at the left. After the plot resizes, the new title is cut off on the right (there should be a colon and some numbers after the “p-val)” ) and the y-axis label is cut-off on the left. It seems that the column layout is not resizing to take into account the fact that the title is now longer and that the y-axis units are now more characters also (a change from ‘1.2’ to ‘169.2’)

How do I have the layout resize appropriately so that none of the text is cut off?

Thanks for the help!!

Minimal, Reproducible Example

import bokeh.embed as embed
import bokeh.events as events
import bokeh.io as bio
import bokeh.layouts as layouts
import bokeh.models as models
import bokeh.models.callbacks as callbacks
import bokeh.models.tools as tools
import bokeh.plotting as plotting
import bokeh.resources
top_plot = bokeh.plotting.figure(
    width = 400,
    height = 400,
    title = "something or other",
    x_axis_label = "some label",
    y_axis_label = "some other label"
)
top_plot.add_layout(bokeh.models.Title(
    text="some very long text at the bottom of the plot that will get cutoff",
    align="right"
), 'below')

top_source = bokeh.models.ColumnDataSource({
    'x': [1,2],
    'y': [1,2]
})

top_circles = top_plot.circle('x', 'y', source=top_source)

bottom_plot = bokeh.plotting.figure(
    width = 400,
    height = 400,
)

bottom_source = bokeh.models.ColumnDataSource({
    'x': [1,2],    'y': [1,2]
})

bottom_circles = bottom_plot.circle('x', 'y', source=bottom_source)
tap_tool = bokeh.models.tools.TapTool()
bottom_plot.add_tools(tap_tool)
bottom_plot.toolbar.active_tap = tap_tool
tap_callback = bokeh.models.CustomJS(
    args=dict(top_plot=top_plot, top_source=top_source),
    code="""
        console.log('foo');
        var new_dict = { 'x': [1,2,3,4], 'y':[1000.001, 1000.002, 1000.003, 1000.004] } ;
        top_source.data = new_dict;
        top_source.change.emit();

        top_plot.title.text = "some very long title that won't all be fully displayed";
    """
)
bottom_source.selected.js_on_change('indices', tap_callback)
layout = bokeh.layouts.column(
    top_plot,
    bottom_plot
)

html = embed.file_html(layout, bokeh.resources.CDN, 'bokeh test 2')
with open("...", 'w') as out_file:
   out_file.write(html)

I am not sure there’s an nice way around all of your problems, but there’s a few I can think of:

  1. the y-axis units changing the plot-size:

Bokeh plots fit everything that belongs to them into the specified plot-width and -height.
Title, toolbar and the axes (and their units) included. You can specify min-border to accomodate everything outside the inner-plot.

snippet
top_plot = bokeh.plotting.figure(
    width = 400,
    height = 400,
    min_border_left=100,
    title = "something or other",
    x_axis_label = "some label",
    y_axis_label = "some other label"
)

Now the extra y-axis units wont change the inner-plot. You can also set a border to allow more room for title. That way it can stretch much farther beyond the inner-plot. (Here: setting min_border_right to something big)

  1. Titles too large

You can give the titles as much room as you want (while keeping the plot size the same) by extending the border. But that would look stupid. Have you looked into maybe splitting the title into multiple titles, like here: python - How to create a multi-line plot title in bokeh? - Stack Overflow.
A bokeh-dev answered that question so I don’t think there’s a better way (unless you want to create a custom extension, which would take some time to understand).

If you want to resize the plot with the title… I’m not sure there’s a nice way to do that. You could manipulate the plot width depending on the amount of characters in the title-string. Else you can just make the plot take all available space with:

layout = bokeh.layouts.column(
    top_plot,
    bottom_plot,
    sizing_mode="stretch_width",
    max_width=600  # optional
)
1 Like

Hi @jmargolpeople

@kaprisonne outlined some really good points about why using plot titles to accomplish your requirement would either be not very robust or not work without excessive effort.

You might try to use bokeh Div models, which give you a separate model to render the text. With a Div you also have much more flexibility to control the appearance. See the example below as a very simple example.

As for the axis titles, I don’t have a great workaround there. My first thought would be perhaps choosing some more succinct language for the actual label and make sure it adheres to all the sizing options you use. If you want more descriptive explanations, you could also try a Div for that as well…

#!/usr/bin/env python3
# -*- coding: utf-8 -*-
"""
"""
from bokeh.models import Div
from bokeh.layouts import Column

from bokeh.plotting import figure
from bokeh.io import show


DIV_TEXT_TEMPLATE = """
    <div style="background-color: #000000; border: 3px solid #000000">
        <span style="color: #FFFFFF; font-weight: bold; font-size: 150%">
        &nbsp {:s} &nbsp
        </span>
    </div>"""

_text = DIV_TEXT_TEMPLATE.format(
    "some really long verbose description ... lorem ipsum dolor ... lorem ipsum dolor ... lorem ipsum dolor ...")

d = Div(text=_text, width=500, min_width=300, max_width=800, sizing_mode='scale_width')
p = figure(width=500, height=500, min_width=300, max_width=800, sizing_mode='scale_width')

show(Column(*[d,p], sizing_mode='scale_width'))