

Can someone please help me with setting an initial zoom on a FactorRange?
For example, suppose I have the following bar plot from the documentation:
from bokeh.io import show, output_notebook
from bokeh.plotting import figure
output_notebook()
Here is a list of categorical values (or factors)
fruits = [‘Apples’, ‘Pears’, ‘Nectarines’, ‘Plums’, ‘Grapes’, ‘Strawberries’]
Set the x_range to the list of categories above
p = figure(x_range=fruits, plot_height=250, title=“Fruit Counts”)
Categorical values can also be used as coordinates
p.vbar(x=fruits, top=[5, 3, 4, 2, 4, 6], width=0.9)
Set some properties to make the plot look better
p.xgrid.grid_line_color = None
p.y_range.start = 0
show(p)
``
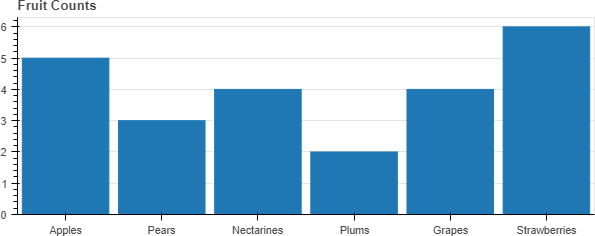
How do I set it so that the initial zoom shows only the first four categories (but the user can pan around to see the other two, zoom out, etc.)?

