
☰Read-only archive⌕
Looking for help with Bokeh?

This is a read-only archive. Ask questions and join the conversation on GitHub.

Visit Community Support on GitHub →
Archived discussions · Captured October 28, 2026

How to shade an area of a catagorical bar chart?

Community Support
RobM
RobM

Hello,
I would like to shade an area of a categorical bar chart but get the error:
AttributeError: ‘Figure’ object has no attribute ‘varea’
Does this mean it is not possible to use vbar and varea together?
This is a minimal example:

from bokeh.io import output_file, show
from bokeh.plotting import figure

output_file("bars.html")

fruits = ['Apples', 'Pears', 'Nectarines', 'Plums', 'Grapes', 'Strawberries']
counts = [5, 3, 4, 2, 4, 6]

p = figure(x_range=fruits, plot_height=250, title="Fruit counts",
           toolbar_location=None, tools="")

p.vbar(x=fruits, top=counts, width=0.9)
p.varea(x=fruits, y1=2, y2=3)
p.xgrid.grid_line_color = None
p.y_range.start = 0

show(p)
⌁   Link to post
RobM
RobM

Hi,
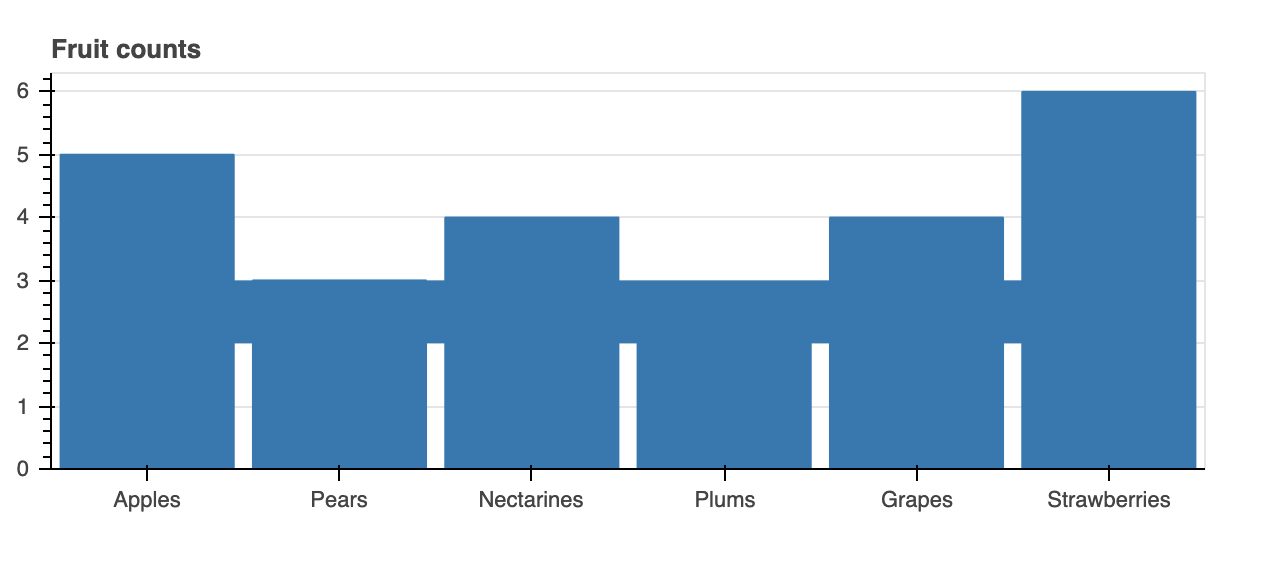
Thanks I’ve updated my environment to one using a more recent version of Bokeh. I’d like to be able to use a hover tool to inspect the area but can’t work out how to do this. Would I need to add a second hover tool some how?

rom bokeh.io import output_file, show
from bokeh.plotting import figure
from bokeh.models.tools import HoverTool

output_file("bars.html")

fruits = ['Apples', 'Pears', 'Nectarines', 'Plums', 'Grapes', 'Strawberries']
counts = [5, 3, 4, 2, 4, 6]
tooltips=[('Index', '$index'), ('Count', '@top')]
p = figure(x_range=fruits, plot_height=250, title="Fruit counts", tools=['hover'], tooltips=tooltips)
hover_tool = p.select(type=HoverTool) 
hover_tool.names = ["bar"]
p.vbar(x=fruits, top=counts, width=0.9, name='bar')
p.varea(x=[0, len(fruits)], y1=2, y2=3, color='red', alpha=0.4, name='area')
p.xgrid.grid_line_color = None
p.y_range.start = 0

show(p)
⌁   Link to post
RobM
RobM

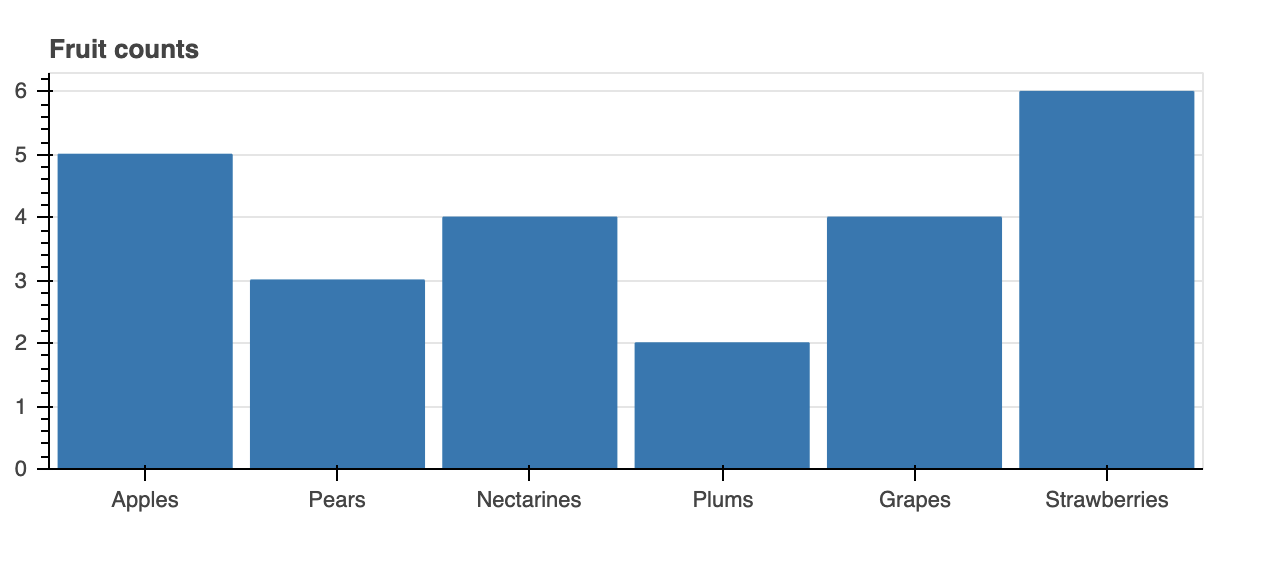
Sorry, perhaps it isn’t possible with varea but I have an example sort of working with patches. What I would like to know is can I specify separate tooltips for the different glyphs? I’d like to avoid the green patch hover tool box showing “Count:???”.

from bokeh.io import output_file, show
from bokeh.plotting import figure
from bokeh.models.tools import HoverTool

output_file("bars.html")

fruits = ['Apples', 'Pears', 'Nectarines', 'Plums', 'Grapes', 'Strawberries']
counts = [5, 3, 4, 2, 4, 6]
tooltips=[('Index', '$index'), ('Count', '@top')]

p = figure(x_range=fruits, plot_height=250, title="Fruit counts", tools=['hover'], tooltips=tooltips)
hover_tool = p.select(type=HoverTool) 
hover_tool.names = ["bar", "patch"]

p.vbar(x=fruits, top=counts, width=0.9, name='bar')
p.varea(x=[0, len(fruits)], y1=2, y2=3, color='red', alpha=0.4, name='area')
p.patches([[0,0,len(fruits),len(fruits)]],[[3,4,4,3]], color='green', alpha=0.4, name='patch')
p.xgrid.grid_line_color = None
p.y_range.start = 0

show(p)
⌁   Link to post
RobM
RobM

thanks that was what I was hoping, but I haven’t worked out how to do it yet. Tools and tooltips are added when setting up the figure, how do I go about adding a second hover tool?

⌁   Link to post
_jm
_jm

@RobM

That’s certainly a common way to include a hover tool but not the only way.

You can create a hover tool and specify its properties including the renderers property as a list that you want to operate on / restrict focus to.

So something like the following where r0 and r1 are two renderers previously created each assigned to its own HoverTool h0 and h1, respectively.

The last line in this sketch/outline assigns both tools to a figure p.

from bokeh.models import HoverTool
...
h0 = HoverTool(renderers=[r0], ...)
h1 = HoverTool(renderers=[r1], ...)
_ = [p.add_tools(tool) for tool in (h0, h1)]
⌁   Link to post
RobM
RobM

Thanks, I’ll give that a go. I had been trying things like this

p = figure(x_range=fruits, plot_height=250, title="Fruit counts", tools=['hover, hover'])

hover0 = p.select(type=HoverTool) 
hover0.names = ["bar"]
hover0.tooltips = [('Index', '$index'), ('Count', '@top')]

hover1 = p.select(type=HoverTool) 
hover1.names = ["patch"]
hover1.tooltips = [('Index', '$index'), ('Y2', '6')]
⌁   Link to post
RobM
RobM

Thanks all, I have a working example now that I think I can work from.

from bokeh.io import output_file, show
from bokeh.plotting import figure
from bokeh.models.tools import HoverTool

output_file("bars.html")

fruits = ['Apples', 'Pears', 'Nectarines', 'Plums', 'Grapes', 'Strawberries']
counts = [5, 3, 4, 2, 4, 6]

p = figure(x_range=fruits, plot_height=250, title="Fruit counts", tools="")

bar = p.vbar(x=fruits, top=counts, width=0.9)
patch = p.patches([[0,0,len(fruits),len(fruits)]],[[3,4,4,3]], color='green', alpha=0.4)

p.xgrid.grid_line_color = None
p.y_range.start = 0

h0 = HoverTool(renderers=[bar]) 
h0.tooltips = [('Index', '$index'), ('Count', '@top')]
p.add_tools(h0)

h1 = HoverTool(renderers=[patch]) 
h1.tooltips = [('Count', '3 to 4')]
p.add_tools(h1)

show(p)
⌁   Link to post

End of archived discussion · Replies are disabled
