For this I generally use the ‘selection’ functionality bokeh offers. Essentially you allow the user to select renderers that are driven by a columndatasource, then you trigger a callback whenever the selected indices change. The real benefit of this setup is that not only can you get at one selected data point at a time, you can use certain tools to “collect” multiple selected data points at once e.g. lasso_select, and then perform some aggregation on that user-defined selection. I’m not doing that in this example, but I hope you see the power of that 
from bokeh.plotting import figure, show
from bokeh.models import ColumnDataSource, CustomJS, Scatter

data = {'x':[1,2,3,4,5],'y':[2,4,6,7,9],'fruit':['banana','orange','apple','grape','blueberry'],'color':['yellow','orange','red','purple','blue']}
src = ColumnDataSource(data=data)
f = figure(tools=['tap','lasso_select'])
sc = Scatter(x='x',y='y',fill_color='color',size=10)
sc_hvr = Scatter(x='x',y='y',fill_color='color',size=10)
sc_rend = f.add_glyph(src,sc,hover_glyph=sc_hvr)

cb = CustomJS(args=dict(src=src)
              ,code='''
              var sel_inds = src.selected.indices
              console.log("Here's what is in this selection")
              for (var i=0;i<sel_inds.length;i++){
                      var sel_i = sel_inds[i]
                      console.log(src.data['fruit'][sel_i])
                      }
              ''')
src.selected.js_on_change('indices',cb)
show(f)
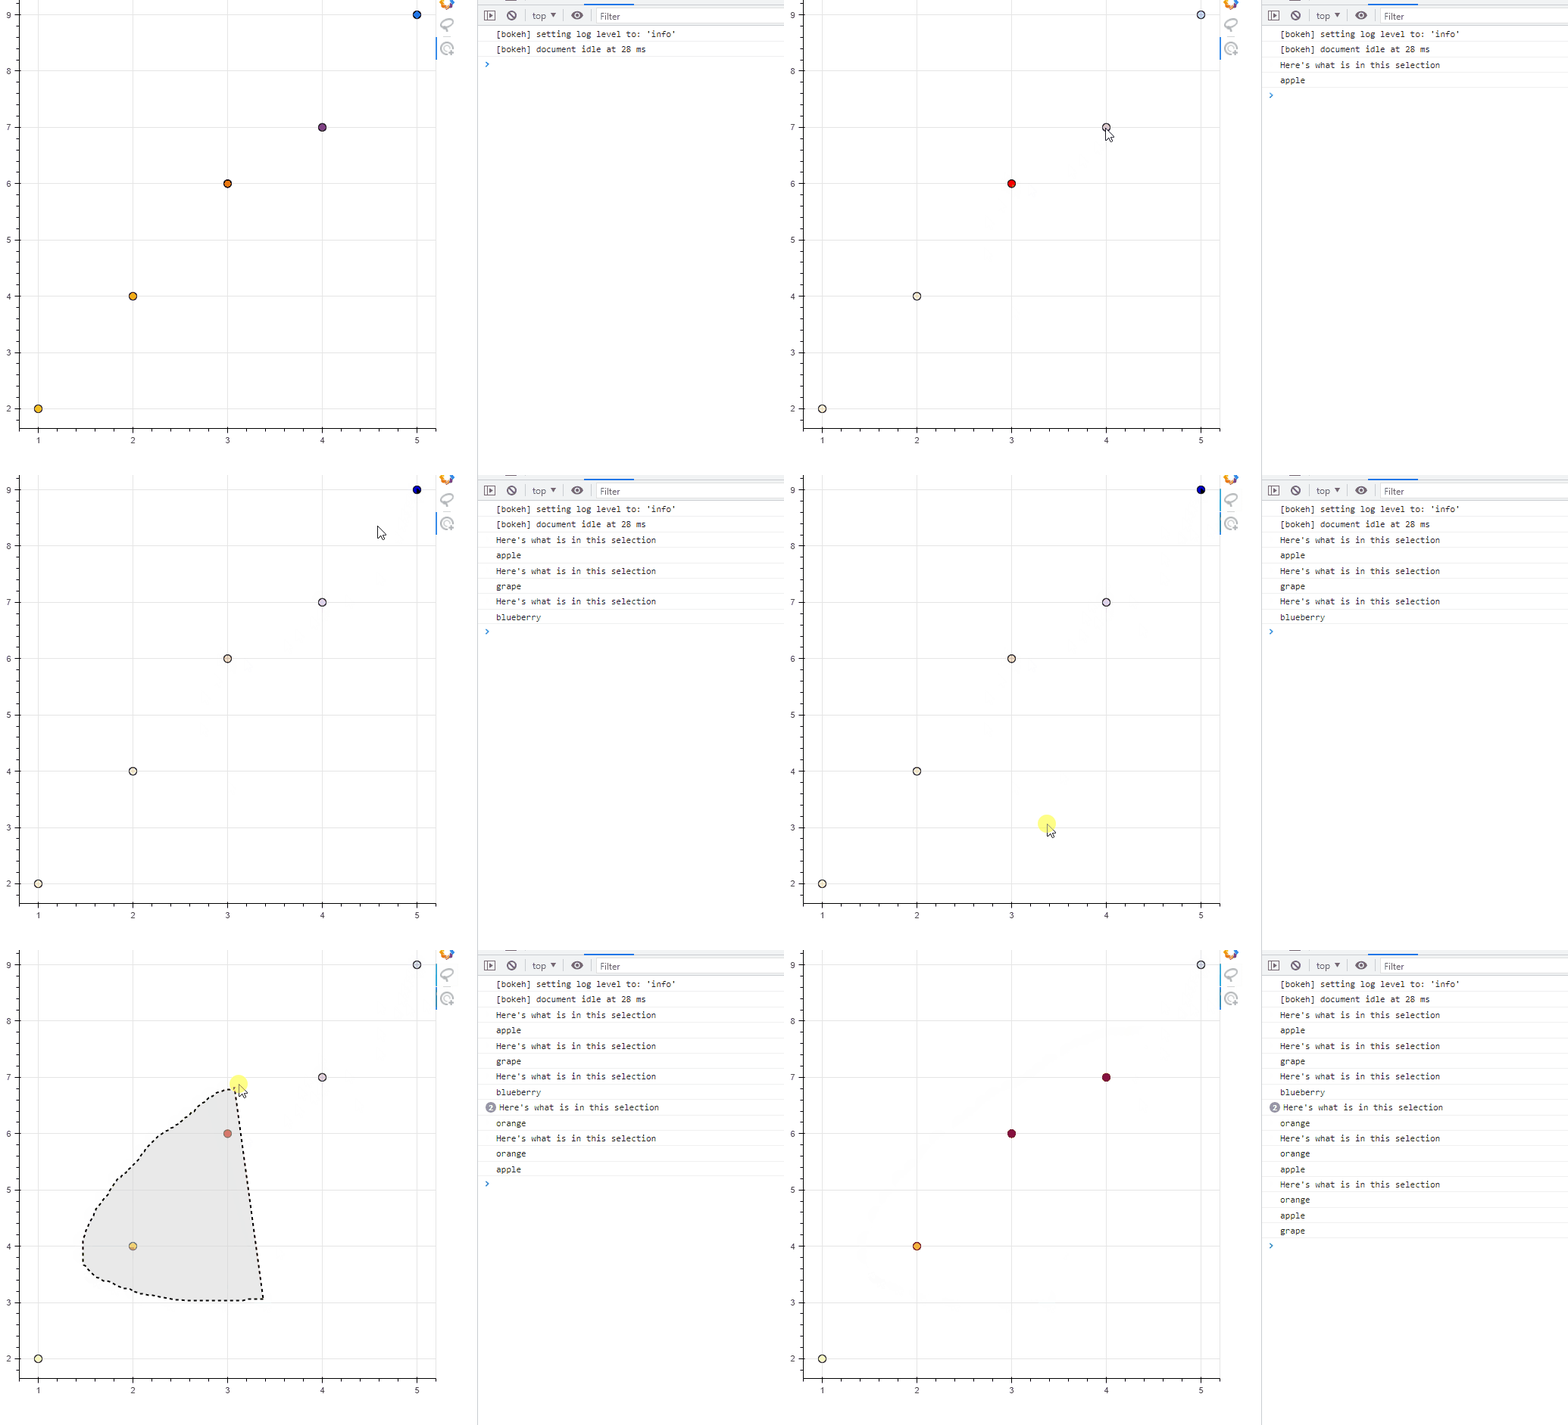
Hope this helps!