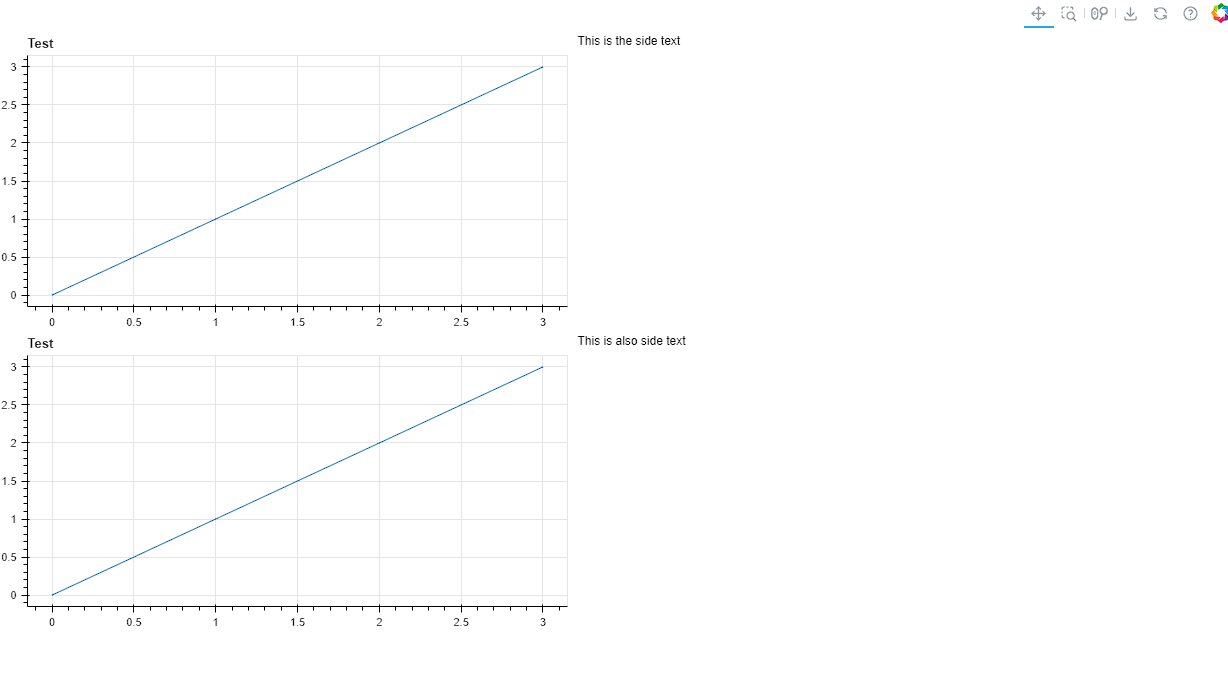
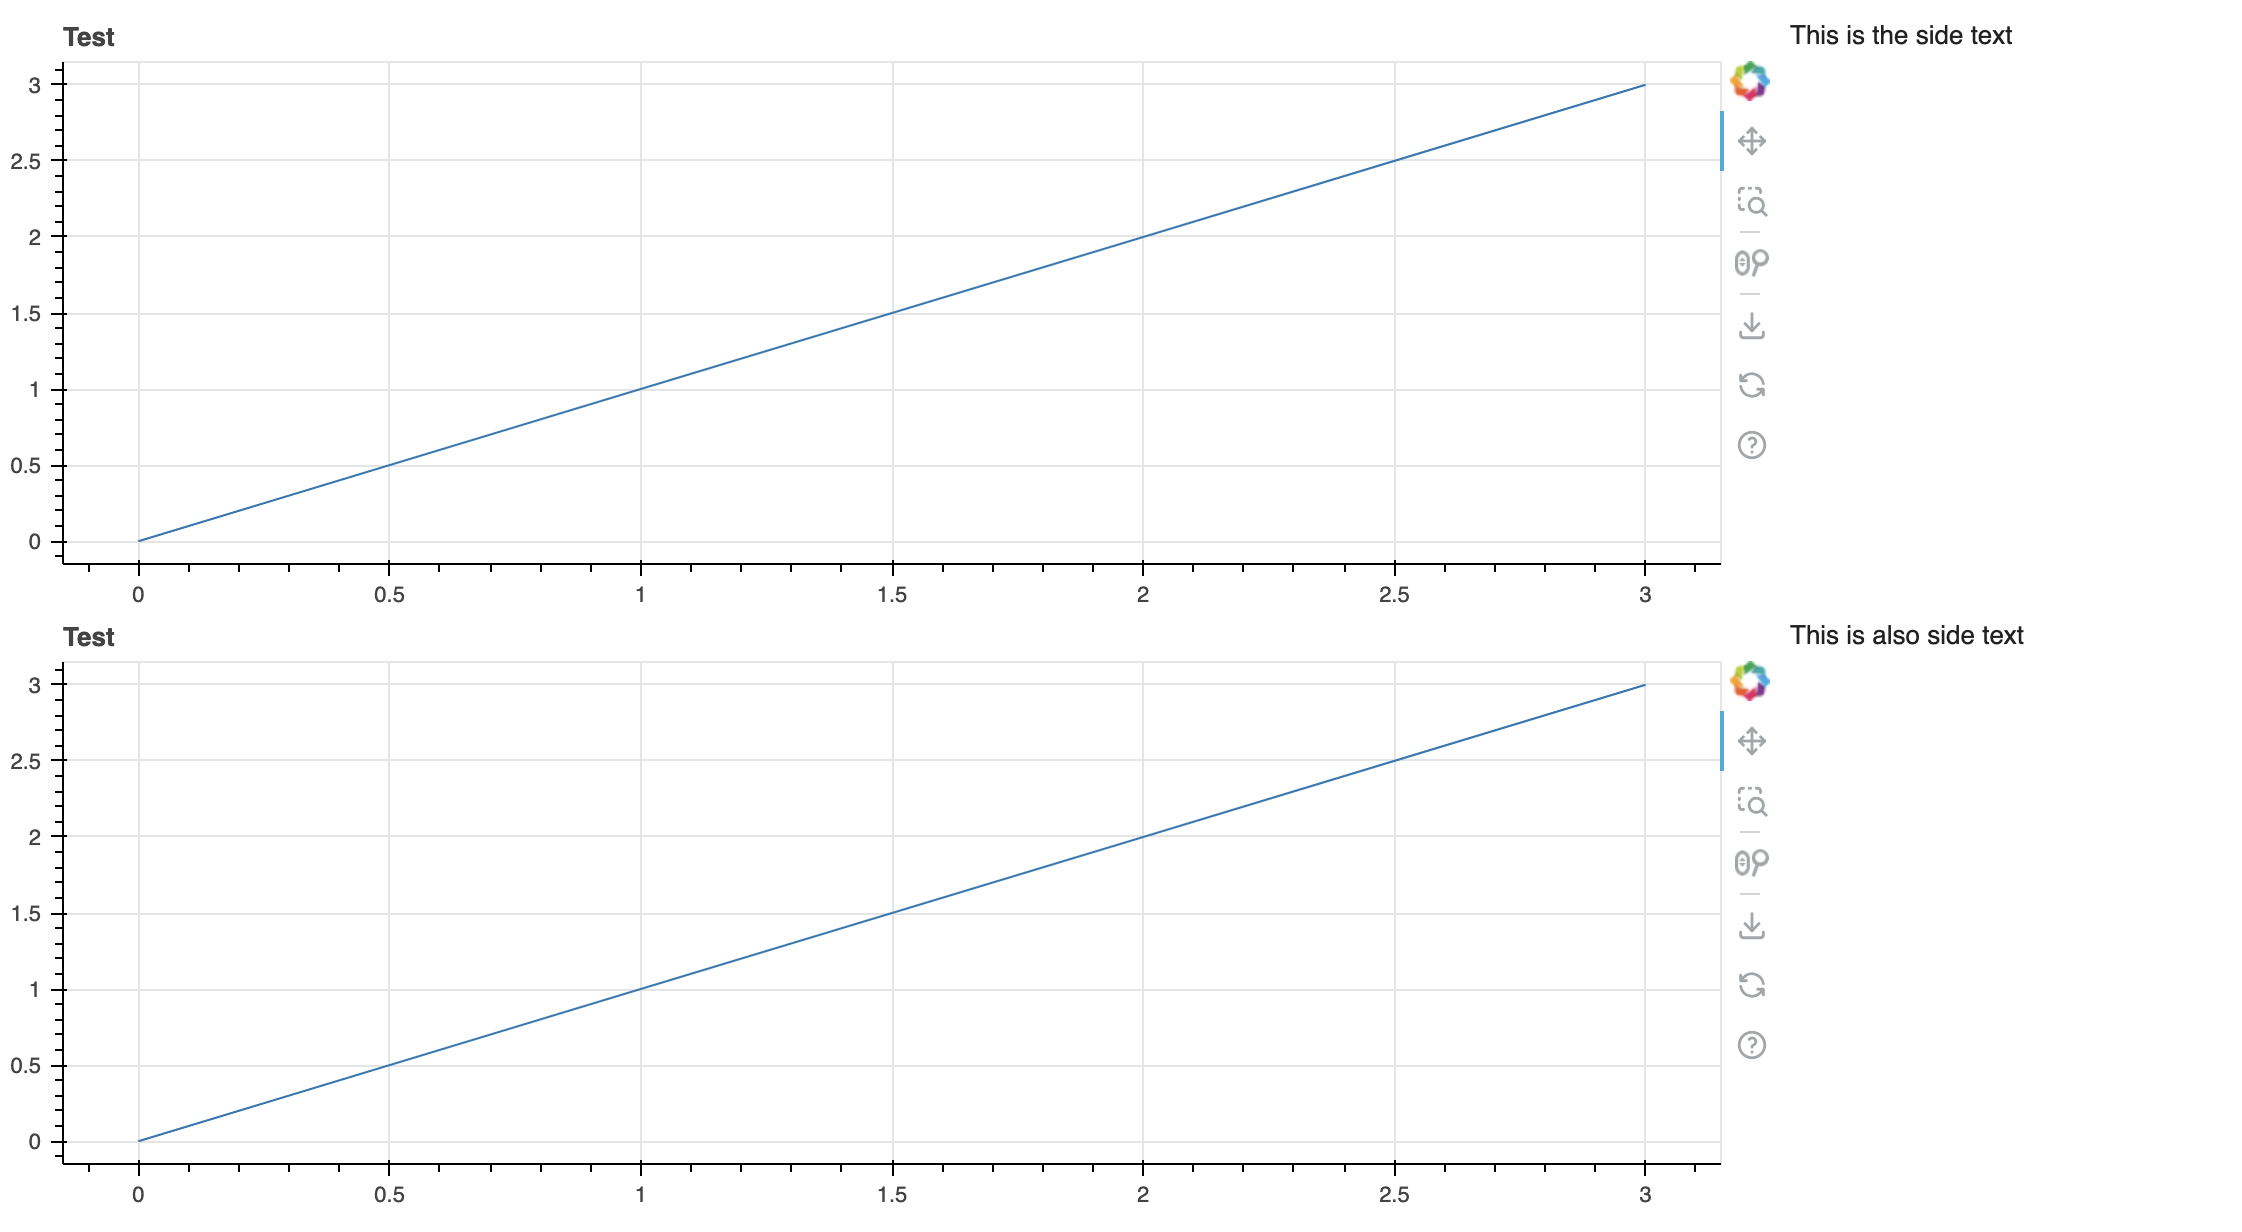
Thanks. That works fine, but what I’m really looking for is more of a grid. I’ve tried a number of approaches, but it really doesn’t come out right. The most sane way that I can see to get there is this code, but it only takes up half the browser width. It does react to window size, though.
from bokeh.plotting import figure, show
from bokeh.layouts import row, column, gridplot
from bokeh.models import Div

data = [0, 1, 2, 3]

p = figure(title="Test", height=300, sizing_mode='stretch_width')
p.line(list(range(4)), data)

p2 = figure(title="Test", height=300, sizing_mode='stretch_width')
p2.line(list(range(4)), data)

d = Div(text='This is the side text', width=200)
d2 = Div(text='This is also side text', width=200)

# r1 = row(p, d)
# r2 = row(p2, d2)
# show(column([r1, r2], sizing_mode='stretch_width'))

show( gridplot([[p,d], [p2,d2]], sizing_mode='stretch_width') )