

☰Read-only archive⌕
Looking for help with Bokeh?

This is a read-only archive. Ask questions and join the conversation on GitHub.

Visit Community Support on GitHub →
Archived discussions · Captured October 28, 2026

I want to use hover(tooltips), but unexpected result appear

Community Supporthoverbokeh
sks020k
sks020k

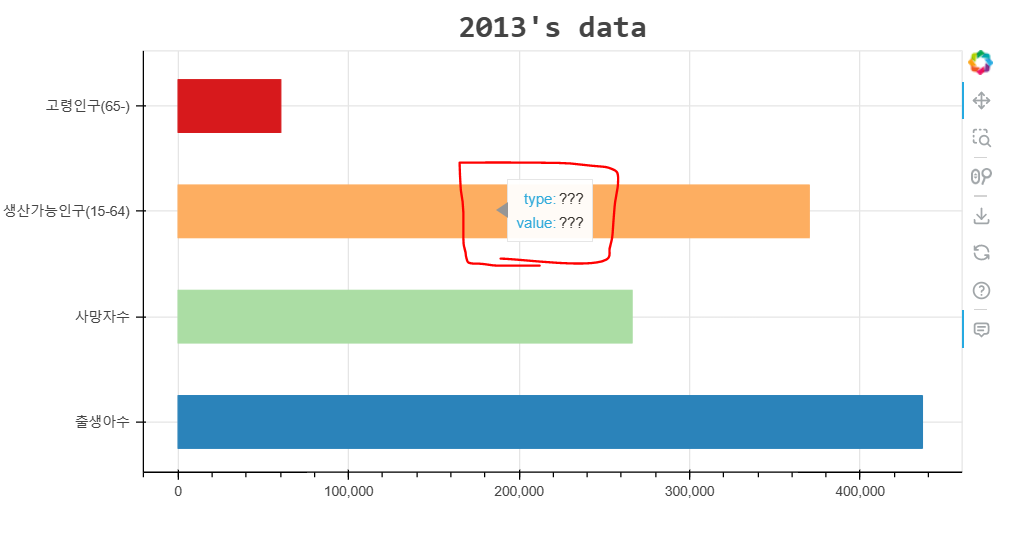
hello. I am in the process of creating an hbar. I tried to use tooltips so that the y value and the right value of the hbar come out when I hover over the graph, but as shown in the picture, type:??? value:??? is displayed, so I tried using hover, but it’s the same. If so, what should I do? The bokeh version is 3.1.0. Any help would be greatly appreciated.
Thank you for help me.

import pandas as pd
from bokeh.plotting import figure, output_file, show
from bokeh.models import ColumnDataSource, HoverTool, Title
from bokeh.palettes import Spectral4
import csv
with open('./lecturespace/2013data.csv') as f:
    reader = csv.reader(f)
    for row in reader:
        if len(row) == 0 or row[0][0] == '#':
            continue
        else:
            print(row)
type = []
value = []
with open('./lecturespace/2013data.csv') as f:
    reader = csv.reader(f)
    for column in reader:
        if len(column) == 0 or column[0][0] == '#':
            continue
        else:
            type.append(str(column[0]))
            value.append(int(column[1]))
from bokeh.models import BasicTickFormatter
from bokeh.models import NumeralTickFormatter

xformatter = NumeralTickFormatter(format="0,0")
p=figure(y_range=type,title=Title(text="2013's data", align="center", text_font_size = "25px",text_font="Consolas", 
        text_font_style="bold"), height=400, width=800,tooltips=tooltips)

colors = {'출생아수': Spectral4[0], '사망자수': Spectral4[1], '생산가능인구(15-64)': Spectral4[2], '고령인구(65-)': Spectral4[3]}
color_list = [colors[t] for t in type]

p.xaxis.formatter = BasicTickFormatter(use_scientific=False)    
p.xaxis.formatter = xformatter                                  

hover = p.select(dict(type=HoverTool))
formatters={'@index1': 'type','@index2' : 'value'}
hover.tooltips = [('type', '@index1'), ('value', '@index2')]

p.hbar(y=type, right=value,height=0.5,color=color_list)
show(p)

This is my csv file data when I run print(row)
[‘출생아수’, ‘436500’]
[‘사망자수’, ‘266257’]
[‘생산가능인구(15-64)’, ‘370140’]
[‘고령인구(65-)’, ‘60230’]
beacuase of new user’s policy, There is one image.

⌁   Link to post
sks020k
sks020k

hmm… Thank you.
Then, should I make a plot using a column datasource rather than a file reader method? I tried making a dic from my existing code and it still gives me ???. But when using columndatasource, the graph is not displayed on the web and only a white screen appears. So i will definitely use the file reader method.

df = pd.read_csv('./lecturespace/2013data.csv', comment='#', header=None, names=['type', 'value'])
source = ColumnDataSource(df)
my_dict = dict(
    type=df['type'],
    value=df['value']
)
hover = HoverTool(
    tooltips=[
        ('Type', '@my_dict'),
        ('Value', '@my_dict')
    ]
)
p.add_tools(hover)

I just added this code to the code I posted. But still ??? came out…
txs…

⌁   Link to post
sks020k
sks020k

oh i solve that

import pandas as pd
from bokeh.plotting import figure, output_file, show
from bokeh.models import ColumnDataSource, HoverTool, Title
from bokeh.palettes import Spectral4
import csv
from bokeh.models import BasicTickFormatter, NumeralTickFormatter
from bokeh.layouts import gridplot

with open('./lecturespace/2013data.csv') as f:
    reader = csv.reader(f)
    birth_death_data = []
    age_data = []
    for row in reader:
        if len(row) == 0 or row[0][0] == '#':
            continue
        if row[0] == '출생아수' or row[0] == '사망자수':
            birth_death_data.append(row)
        elif row[0] == '생산가능인구(15-64)' or row[0] == '고령인구(65-)':
            age_data.append(row)

birth_death_df = pd.DataFrame(birth_death_data, columns=['type', 'value'])
age_df = pd.DataFrame(age_data, columns=['type', 'value'])

birth_death_source = ColumnDataSource(birth_death_df)
age_source = ColumnDataSource(age_df)
import pandas as pd
from bokeh.plotting import figure, output_file, show
from bokeh.models import ColumnDataSource, HoverTool, Title
from bokeh.palettes import Spectral4
import csv
from bokeh.models import BasicTickFormatter, NumeralTickFormatter
from bokeh.layouts import gridplot

with open('./lecturespace/2013data.csv') as f:
    reader = csv.reader(f)
    birth_death_data = []
    age_data = []
    for row in reader:
        if len(row) == 0 or row[0][0] == '#':
            continue
        if row[0] == '출생아수' or row[0] == '사망자수':
            birth_death_data.append(row)
        elif row[0] == '생산가능인구(15-64)' or row[0] == '고령인구(65-)':
            age_data.append(row)

birth_death_df = pd.DataFrame(birth_death_data, columns=['type', 'value'])
age_df = pd.DataFrame(age_data, columns=['type', 'value'])

birth_death_source = ColumnDataSource(birth_death_df)
age_source = ColumnDataSource(age_df)
xformatter = NumeralTickFormatter(format="0,0")
p1 = figure(y_range=birth_death_df['type'], title=Title(text="2013년 출생아 수 사망자 수", align="center", text_font_size="25px", text_font="Consolas", text_font_style="bold"), height=500, width=500)
p1.hbar(y='type', right='value', height=0.3, color=Spectral4[0], source=birth_death_source)
p1.xaxis.formatter = NumeralTickFormatter(format="0,0")
p1.xaxis.formatter = xformatter
p1.add_tools(HoverTool(tooltips=[("Type", "@type"), ("Value", "@value")]))

p2 = figure(y_range=age_df['type'], title=Title(text="2013년 생산가능 인구와 고령인구 수(단위 : 백 명)", align="center", text_font_size="25px", text_font="Consolas", text_font_style="bold"), height=500, width=500)
p2.hbar(y='type', right='value', height=0.3, color=Spectral4[1], source=age_source)
p2.xaxis.formatter = NumeralTickFormatter(format="0,0")
p2.xaxis.formatter = xformatter
p2.add_tools(HoverTool(tooltips=[("Type", "@type"), ("Value", "@value")]))

layout = gridplot([[p1, p2]])

show(layout)
⌁   Link to post

End of archived discussion · Replies are disabled
