☰Read-only archive⌕
Looking for help with Bokeh?

This is a read-only archive. Ask questions and join the conversation on GitHub.

Visit Community Support on GitHub →
Archived discussions · Captured October 28, 2026

Identify Lines on hover.

Community Support
piqo
piqo

Hi,
How do I show the line name (language variable, in my case) when hovering on a line chart?
Using hover, I can see X, and Y values, but no line name (indicator). It simply shows ??? (or when I use @language it shows single characters of the language names)
My hover is:
languages = [‘English’, ‘German’, ‘Portugese’]
hover = HoverTool(
tooltips = “”"


$language
[$index]


Location
($x, $y)

“”"
)

for language in languages:
# I fill here x, y lists with data for each language appropriately…

** source = ColumnDataSource(
data=dict(
x=x,
y=y,
language=language,
)
)
p.line(‘x’, ‘y’, legend=str(language), size=10, line_color=colors.pop(), source=source)**

⌁   Link to post
Sarah_Bird3
Sarah_Bird3

Try:
p.line(‘x’, ‘y’, legend=[str(language)], size=10, line_color=colors.pop(), source=source)

And you definitely want @ as the prefix for all the fields.

Cheers,

Bird

···

On Thu, Jun 11, 2015 at 11:00 PM, piqo piqoni@gmail.com wrote:

Hi,
How do I show the line name (language variable, in my case) when hovering on a line chart?
Using hover, I can see X, and Y values, but no line name (indicator). It simply shows ??? (or when I use @language it shows single characters of the language names)
My hover is:
languages = [‘English’, ‘German’, ‘Portugese’]
hover = HoverTool(
tooltips = “”"


$language
[$index]


Location
($x, $y)

“”"
)

for language in languages:
# I fill here x, y lists with data for each language appropriately…

** source = ColumnDataSource(
data=dict(
x=x,
y=y,
language=language,
)
)
p.line(‘x’, ‘y’, legend=str(language), size=10, line_color=colors.pop(), source=source)**

–

You received this message because you are subscribed to the Google Groups “Bokeh Discussion - Public” group.

To unsubscribe from this group and stop receiving emails from it, send an email to bokeh+unsubscribe@continuum.io.

To post to this group, send email to bokeh@continuum.io.

To view this discussion on the web visit https://groups.google.com/a/continuum.io/d/msgid/bokeh/71a2ed03-eb26-4e79-858d-abfcd428481a%40continuum.io.

For more options, visit https://groups.google.com/a/continuum.io/d/optout.

⌁   Link to post
Bryan
Bryan

Hi piqo,

All the columns in column data sources need to be the same length. You can think of it a bit like a poor-man's DataFrame. It looks like you are setting "x" and "y" columns as lists, but "language" as a single value? If so, that is probably the problem. Of course, duplicating the language for every point is pretty redundant, so we may need to add some new features to help with use cases like this. You might try "multi_line" instead of line to draw all the lines with one glyph and source and tool, but I am not sure offhand if hover works with multi_line yet or not.

Bryan

···

On Jun 11, 2015, at 5:00 PM, piqo <piqoni@gmail.com> wrote:

Hi,

How do I show the line name (language variable, in my case) when hovering on a line chart?

Using hover, I can see X, and Y values, but no line name (indicator). It simply shows ??? (or when I use @language it shows single characters of the language names)

My hover is:

languages = ['English', 'German', 'Portugese']

hover = HoverTool(
    tooltips = """
    <div>
        <span>$language</span>
        <span>[$index]</span>
    </div>
    <div>
        <span>Location</span>
        <span>($x, $y)</span>
    </div>
    """
)

for language in languages:
            # I fill here x, y lists with data for each language appropriately...

   source = ColumnDataSource(
    data=dict(
        x=x,
        y=y,
        language=language,
    )
)

    p.line('x', 'y', legend=str(language), size=10, line_color=colors.pop(), source=source)

--
You received this message because you are subscribed to the Google Groups "Bokeh Discussion - Public" group.
To unsubscribe from this group and stop receiving emails from it, send an email to bokeh+unsubscribe@continuum.io.
To post to this group, send email to bokeh@continuum.io.
To view this discussion on the web visit https://groups.google.com/a/continuum.io/d/msgid/bokeh/71a2ed03-eb26-4e79-858d-abfcd428481a%40continuum.io\.
For more options, visit https://groups.google.com/a/continuum.io/d/optout\.

⌁   Link to post
Sarah_Bird3
Sarah_Bird3

Also you probably don’t need this in a for loop.

If you have a table:

xs , ys , language

[x1, x2] , [y1, y2] , lang_1
[x3, x4] , [y3, y4] , lang_2

Then you can, I think, use

p.multiline(xs=‘xs’, ys=‘ys’, legend=‘language’)

(I haven’t tried this)

···

On Fri, Jun 12, 2015 at 12:26 AM, Sarah Bird sbird@alum.mit.edu wrote:

Try:
p.line(‘x’, ‘y’, legend=[str(language)], size=10, line_color=colors.pop(), source=source)

And you definitely want @ as the prefix for all the fields.

Cheers,

Bird

On Thu, Jun 11, 2015 at 11:00 PM, piqo piqoni@gmail.com wrote:

Hi,
How do I show the line name (language variable, in my case) when hovering on a line chart?
Using hover, I can see X, and Y values, but no line name (indicator). It simply shows ??? (or when I use @language it shows single characters of the language names)
My hover is:
languages = [‘English’, ‘German’, ‘Portugese’]
hover = HoverTool(
tooltips = “”"


$language
[$index]


Location
($x, $y)

“”"
)

for language in languages:
# I fill here x, y lists with data for each language appropriately…

** source = ColumnDataSource(
data=dict(
x=x,
y=y,
language=language,
)
)
p.line(‘x’, ‘y’, legend=str(language), size=10, line_color=colors.pop(), source=source)**

–

You received this message because you are subscribed to the Google Groups “Bokeh Discussion - Public” group.

To unsubscribe from this group and stop receiving emails from it, send an email to bokeh+unsubscribe@continuum.io.

To post to this group, send email to bokeh@continuum.io.

To view this discussion on the web visit https://groups.google.com/a/continuum.io/d/msgid/bokeh/71a2ed03-eb26-4e79-858d-abfcd428481a%40continuum.io.

For more options, visit https://groups.google.com/a/continuum.io/d/optout.

⌁   Link to post
Bryan
Bryan

Is this documented anywhere? I'm not sure why it should work offhand.

Bryan

···

On Jun 11, 2015, at 6:26 PM, Sarah Bird <sbird@alum.mit.edu> wrote:

Try:

p.line('x', 'y', legend=[str(language)], size=10, line_color=colors.pop(), source=source)

And you definitely want @ as the prefix for all the fields.

Cheers,

Bird

On Thu, Jun 11, 2015 at 11:00 PM, piqo <piqoni@gmail.com> wrote:
Hi,

How do I show the line name (language variable, in my case) when hovering on a line chart?

Using hover, I can see X, and Y values, but no line name (indicator). It simply shows ??? (or when I use @language it shows single characters of the language names)

My hover is:

languages = ['English', 'German', 'Portugese']

hover = HoverTool(
    tooltips = """
    <div>
        <span>$language</span>
        <span>[$index]</span>
    </div>
    <div>
        <span>Location</span>
        <span>($x, $y)</span>
    </div>
    """
)

for language in languages:
            # I fill here x, y lists with data for each language appropriately...

   source = ColumnDataSource(
    data=dict(
        x=x,
        y=y,
        language=language,
    )
)

    p.line('x', 'y', legend=str(language), size=10, line_color=colors.pop(), source=source)

--
You received this message because you are subscribed to the Google Groups "Bokeh Discussion - Public" group.
To unsubscribe from this group and stop receiving emails from it, send an email to bokeh+unsubscribe@continuum.io.
To post to this group, send email to bokeh@continuum.io.
To view this discussion on the web visit https://groups.google.com/a/continuum.io/d/msgid/bokeh/71a2ed03-eb26-4e79-858d-abfcd428481a%40continuum.io\.
For more options, visit https://groups.google.com/a/continuum.io/d/optout\.

--
You received this message because you are subscribed to the Google Groups "Bokeh Discussion - Public" group.
To unsubscribe from this group and stop receiving emails from it, send an email to bokeh+unsubscribe@continuum.io.
To post to this group, send email to bokeh@continuum.io.
To view this discussion on the web visit https://groups.google.com/a/continuum.io/d/msgid/bokeh/CA%2BEr%2BdRLSXDQVYZutw3JQSEAJo%3DEHFRJPLKaxN%3DO_U-NJNqh1g%40mail.gmail.com\.
For more options, visit https://groups.google.com/a/continuum.io/d/optout\.

⌁   Link to post
Sarah_Bird3
Sarah_Bird3

Legend probably won’t, sorry, it’s late, I shouldn’t be answering questions!

Re: multi_line - I think you’re right that hover doesn’t work. I may have a quick poke, as I’m poking - https://github.com/bokeh/bokeh/issues/2376

···

On Fri, Jun 12, 2015 at 12:30 AM, Bryan Van de Ven bryan@bokeh.org wrote:

Is this documented anywhere? I’m not sure why it should work offhand.

Bryan

On Jun 11, 2015, at 6:26 PM, Sarah Bird sbird@alum.mit.edu wrote:

Try:

p.line(‘x’, ‘y’, legend=[str(language)], size=10, line_color=colors.pop(), source=source)

And you definitely want @ as the prefix for all the fields.

Cheers,

Bird

On Thu, Jun 11, 2015 at 11:00 PM, piqo piqoni@gmail.com wrote:

Hi,

How do I show the line name (language variable, in my case) when hovering on a line chart?

Using hover, I can see X, and Y values, but no line name (indicator). It simply shows ??? (or when I use @language it shows single characters of the language names)

My hover is:

languages = [‘English’, ‘German’, ‘Portugese’]

hover = HoverTool(

tooltips = """
<div>
    <span>$language</span>
    <span>[$index]</span>
</div>
<div>
    <span>Location</span>
    <span>($x, $y)</span>
</div>
"""

)

for language in languages:

        # I fill here x, y lists with data for each language appropriately...

source = ColumnDataSource(

data=dict(
    x=x,
    y=y,
    language=language,
)

)

p.line('x', 'y', legend=str(language), size=10, line_color=colors.pop(),  source=source)

–

You received this message because you are subscribed to the Google Groups “Bokeh Discussion - Public” group.

To unsubscribe from this group and stop receiving emails from it, send an email to bokeh+unsubscribe@continuum.io.

To post to this group, send email to bokeh@continuum.io.

To view this discussion on the web visit https://groups.google.com/a/continuum.io/d/msgid/bokeh/71a2ed03-eb26-4e79-858d-abfcd428481a%40continuum.io.

For more options, visit https://groups.google.com/a/continuum.io/d/optout.

–

You received this message because you are subscribed to the Google Groups “Bokeh Discussion - Public” group.

To unsubscribe from this group and stop receiving emails from it, send an email to bokeh+unsubscribe@continuum.io.

To post to this group, send email to bokeh@continuum.io.

To view this discussion on the web visit https://groups.google.com/a/continuum.io/d/msgid/bokeh/CA%2BEr%2BdRLSXDQVYZutw3JQSEAJo%3DEHFRJPLKaxN%3DO_U-NJNqh1g%40mail.gmail.com.

For more options, visit https://groups.google.com/a/continuum.io/d/optout.

–

You received this message because you are subscribed to the Google Groups “Bokeh Discussion - Public” group.

To unsubscribe from this group and stop receiving emails from it, send an email to bokeh+unsubscribe@continuum.io.

To post to this group, send email to bokeh@continuum.io.

To view this discussion on the web visit https://groups.google.com/a/continuum.io/d/msgid/bokeh/1C7489F5-90E5-48F6-A10D-D0DA155A58A6%40continuum.io.
For more options, visit https://groups.google.com/a/continuum.io/d/optout.

⌁   Link to post
piqo
piqo

Thank you folks for responding so quickly.
@Sarah
I didn’t have any issue with the dynamically generated legend. But making it a list would throw an exception:
File “/usr/local/lib/python2.7/dist-packages/bokeh/_glyph_functions.py”, line 73, in func
legends.setdefault(legend_name, []).append(glyph_renderer)
File “/usr/lib/python2.7/collections.py”, line 148, in setdefault
if key in self:
TypeError: unhashable type: ‘list’

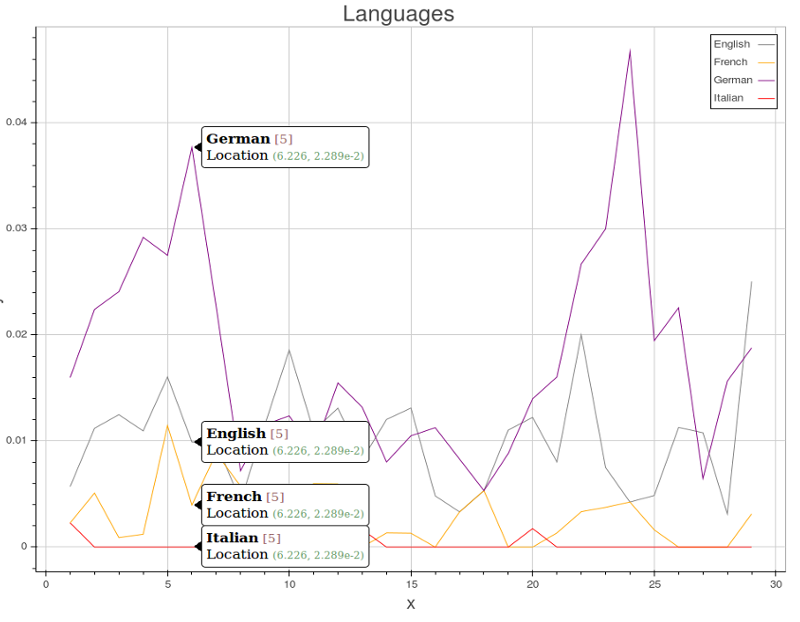
Anyways, the solution I derived from your comments was the following:
source = ColumnDataSource(
data=dict(
x=x,
y=y,
c=[language] * len(x),
)
)

But I agree, there should be something more elegant than this solution.

Attached screen-shot of working example.

Thanks for your help,
Piqo

···

On Friday, June 12, 2015 at 1:37:42 AM UTC+2, Sarah Bird wrote:

Legend probably won’t, sorry, it’s late, I shouldn’t be answering questions!

Re: multi_line - I think you’re right that hover doesn’t work. I may have a quick poke, as I’m poking - https://github.com/bokeh/bokeh/issues/2376

On Fri, Jun 12, 2015 at 12:30 AM, Bryan Van de Ven bry...@continuum.io wrote:

Is this documented anywhere? I’m not sure why it should work offhand.

Bryan

On Jun 11, 2015, at 6:26 PM, Sarah Bird sb...@alum.mit.edu wrote:

Try:

p.line(‘x’, ‘y’, legend=[str(language)], size=10, line_color=colors.pop(), source=source)

And you definitely want @ as the prefix for all the fields.

Cheers,

Bird

On Thu, Jun 11, 2015 at 11:00 PM, piqo piq...@gmail.com wrote:

Hi,

How do I show the line name (language variable, in my case) when hovering on a line chart?

Using hover, I can see X, and Y values, but no line name (indicator). It simply shows ??? (or when I use @language it shows single characters of the language names)

My hover is:

languages = [‘English’, ‘German’, ‘Portugese’]

hover = HoverTool(

tooltips = """
<div>
    <span>$language</span>
    <span>[$index]</span>
</div>
<div>
    <span>Location</span>
    <span>($x, $y)</span>
</div>
"""

)

for language in languages:

        # I fill here x, y lists with data for each language appropriately...

source = ColumnDataSource(

data=dict(
    x=x,
    y=y,
    language=language,
)

)

p.line('x', 'y', legend=str(language), size=10, line_color=colors.pop(),  source=source)

–

You received this message because you are subscribed to the Google Groups “Bokeh Discussion - Public” group.

To unsubscribe from this group and stop receiving emails from it, send an email to bokeh+un...@continuum.io.

To post to this group, send email to bo...@continuum.io.

To view this discussion on the web visit https://groups.google.com/a/continuum.io/d/msgid/bokeh/71a2ed03-eb26-4e79-858d-abfcd428481a%40continuum.io.

For more options, visit https://groups.google.com/a/continuum.io/d/optout.

–

You received this message because you are subscribed to the Google Groups “Bokeh Discussion - Public” group.

To unsubscribe from this group and stop receiving emails from it, send an email to bokeh+un...@continuum.io.

To post to this group, send email to bo...@continuum.io.

To view this discussion on the web visit https://groups.google.com/a/continuum.io/d/msgid/bokeh/CA%2BEr%2BdRLSXDQVYZutw3JQSEAJo%3DEHFRJPLKaxN%3DO_U-NJNqh1g%40mail.gmail.com.

For more options, visit https://groups.google.com/a/continuum.io/d/optout.

–

You received this message because you are subscribed to the Google Groups “Bokeh Discussion - Public” group.

To unsubscribe from this group and stop receiving emails from it, send an email to bokeh+un...@continuum.io.

To post to this group, send email to bo...@continuum.io.

To view this discussion on the web visit https://groups.google.com/a/continuum.io/d/msgid/bokeh/1C7489F5-90E5-48F6-A10D-D0DA155A58A6%40continuum.io.
For more options, visit https://groups.google.com/a/continuum.io/d/optout.

⌁   Link to post
Sarah_Bird3
Sarah_Bird3

Hey, that looks great - if you’re able to post the code or a working notebook that would be awesome!

···

On Fri, Jun 12, 2015 at 8:53 PM, piqo piqoni@gmail.com wrote:

Thank you folks for responding so quickly.
@Sarah
I didn’t have any issue with the dynamically generated legend. But making it a list would throw an exception:
File “/usr/local/lib/python2.7/dist-packages/bokeh/_glyph_functions.py”, line 73, in func
legends.setdefault(legend_name, []).append(glyph_renderer)
File “/usr/lib/python2.7/collections.py”, line 148, in setdefault
if key in self:
TypeError: unhashable type: ‘list’

Anyways, the solution I derived from your comments was the following:
__ source = ColumnDataSource(
data=dict(
x=x,
y=y,
c=[language] * len(x),
)
)__

But I agree, there should be something more elegant than this solution.

Attached screen-shot of working example.

Thanks for your help,
Piqo

On Friday, June 12, 2015 at 1:37:42 AM UTC+2, Sarah Bird wrote:

Legend probably won’t, sorry, it’s late, I shouldn’t be answering questions!

Re: multi_line - I think you’re right that hover doesn’t work. I may have a quick poke, as I’m poking - https://github.com/bokeh/bokeh/issues/2376

On Fri, Jun 12, 2015 at 12:30 AM, Bryan Van de Ven bry...@continuum.io wrote:

Is this documented anywhere? I’m not sure why it should work offhand.

Bryan

On Jun 11, 2015, at 6:26 PM, Sarah Bird sb...@alum.mit.edu wrote:

Try:

p.line(‘x’, ‘y’, legend=[str(language)], size=10, line_color=colors.pop(), source=source)

And you definitely want @ as the prefix for all the fields.

Cheers,

Bird

On Thu, Jun 11, 2015 at 11:00 PM, piqo piq...@gmail.com wrote:

Hi,

How do I show the line name (language variable, in my case) when hovering on a line chart?

Using hover, I can see X, and Y values, but no line name (indicator). It simply shows ??? (or when I use @language it shows single characters of the language names)

My hover is:

languages = [‘English’, ‘German’, ‘Portugese’]

hover = HoverTool(

tooltips = """
<div>
    <span>$language</span>
    <span>[$index]</span>
</div>
<div>
    <span>Location</span>
    <span>($x, $y)</span>
</div>
"""

)

for language in languages:

        # I fill here x, y lists with data for each language appropriately...

source = ColumnDataSource(

data=dict(
    x=x,
    y=y,
    language=language,
)

)

p.line('x', 'y', legend=str(language), size=10, line_color=colors.pop(),  source=source)

–

You received this message because you are subscribed to the Google Groups “Bokeh Discussion - Public” group.

To unsubscribe from this group and stop receiving emails from it, send an email to bokeh+un...@continuum.io.

To post to this group, send email to bo...@continuum.io.

To view this discussion on the web visit https://groups.google.com/a/continuum.io/d/msgid/bokeh/71a2ed03-eb26-4e79-858d-abfcd428481a%40continuum.io.

For more options, visit https://groups.google.com/a/continuum.io/d/optout.

–

You received this message because you are subscribed to the Google Groups “Bokeh Discussion - Public” group.

To unsubscribe from this group and stop receiving emails from it, send an email to bokeh+un...@continuum.io.

To post to this group, send email to bo...@continuum.io.

To view this discussion on the web visit https://groups.google.com/a/continuum.io/d/msgid/bokeh/CA%2BEr%2BdRLSXDQVYZutw3JQSEAJo%3DEHFRJPLKaxN%3DO_U-NJNqh1g%40mail.gmail.com.

For more options, visit https://groups.google.com/a/continuum.io/d/optout.

–

You received this message because you are subscribed to the Google Groups “Bokeh Discussion - Public” group.

To unsubscribe from this group and stop receiving emails from it, send an email to bokeh+un...@continuum.io.

To post to this group, send email to bo...@continuum.io.

To view this discussion on the web visit https://groups.google.com/a/continuum.io/d/msgid/bokeh/1C7489F5-90E5-48F6-A10D-D0DA155A58A6%40continuum.io.
For more options, visit https://groups.google.com/a/continuum.io/d/optout.

–

You received this message because you are subscribed to the Google Groups “Bokeh Discussion - Public” group.

To unsubscribe from this group and stop receiving emails from it, send an email to bokeh+unsubscribe@continuum.io.

To post to this group, send email to bokeh@continuum.io.

To view this discussion on the web visit https://groups.google.com/a/continuum.io/d/msgid/bokeh/661416b3-79c3-4e35-a8d9-bd98eb594460%40continuum.io.

For more options, visit https://groups.google.com/a/continuum.io/d/optout.

⌁   Link to post
piqo
piqo

I had to remove my db calls, and the ‘dynamic’ data so I put some random data, just for the sake of the example:

import random

from bokeh.plotting import figure, output_file, show, ColumnDataSource
from bokeh.models import HoverTool

from collections import OrderedDict

hover = HoverTool()
hover.tooltips = OrderedDict([
(“Language”, “@c”),
(“Location”, “$x, $y”),
])

languages = [‘English’, ‘French’, ‘German’, ‘Italian’]

colors = [‘coral’, ‘brown’, ‘blue’, ‘green’, ‘black’,
‘red’, ‘purple’, ‘orange’, ‘grey’, ‘lightblue’]

p = figure(plot_width=1000, plot_height=800, title=“Languages”,
x_axis_label=‘x’, y_axis_label=‘%’, tools=[hover])

x = [x for x in xrange(30)]

output_file(“languages.html”, title=“Languages”)

for language in languages:
y = [random.uniform(1, 100) for i in xrange(30)]

source = ColumnDataSource(
    data=dict(
        x=x,
        y=y,
        c=[language] * len(x),
        )
    )

p.line('x', 'y', legend=str(language), x_axis_type="date",
       line_width=3, line_color=colors.pop(),  source=source)
del y

show(p)

Best,
piqo

···

On Saturday, June 13, 2015 at 12:49:11 AM UTC+2, Sarah Bird wrote:

Hey, that looks great - if you’re able to post the code or a working notebook that would be awesome!

On Fri, Jun 12, 2015 at 8:53 PM, piqo piq...@gmail.com wrote:

Thank you folks for responding so quickly.
@Sarah
I didn’t have any issue with the dynamically generated legend. But making it a list would throw an exception:
File “/usr/local/lib/python2.7/dist-packages/bokeh/_glyph_functions.py”, line 73, in func
legends.setdefault(legend_name, []).append(glyph_renderer)
File “/usr/lib/python2.7/collections.py”, line 148, in setdefault
if key in self:
TypeError: unhashable type: ‘list’

Anyways, the solution I derived from your comments was the following:
__ source = ColumnDataSource(
data=dict(
x=x,
y=y,
c=[language] * len(x),
)
)__

But I agree, there should be something more elegant than this solution.

Attached screen-shot of working example.

Thanks for your help,
Piqo

On Friday, June 12, 2015 at 1:37:42 AM UTC+2, Sarah Bird wrote:

Legend probably won’t, sorry, it’s late, I shouldn’t be answering questions!

Re: multi_line - I think you’re right that hover doesn’t work. I may have a quick poke, as I’m poking - https://github.com/bokeh/bokeh/issues/2376

On Fri, Jun 12, 2015 at 12:30 AM, Bryan Van de Ven bry...@continuum.io wrote:

Is this documented anywhere? I’m not sure why it should work offhand.

Bryan

On Jun 11, 2015, at 6:26 PM, Sarah Bird sb...@alum.mit.edu wrote:

Try:

p.line(‘x’, ‘y’, legend=[str(language)], size=10, line_color=colors.pop(), source=source)

And you definitely want @ as the prefix for all the fields.

Cheers,

Bird

On Thu, Jun 11, 2015 at 11:00 PM, piqo piq...@gmail.com wrote:

Hi,

How do I show the line name (language variable, in my case) when hovering on a line chart?

Using hover, I can see X, and Y values, but no line name (indicator). It simply shows ??? (or when I use @language it shows single characters of the language names)

My hover is:

languages = [‘English’, ‘German’, ‘Portugese’]

hover = HoverTool(

tooltips = """
<div>
    <span>$language</span>
    <span>[$index]</span>
</div>
<div>
    <span>Location</span>
    <span>($x, $y)</span>
</div>
"""

)

for language in languages:

        # I fill here x, y lists with data for each language appropriately...

source = ColumnDataSource(

data=dict(
    x=x,
    y=y,
    language=language,
)

)

p.line('x', 'y', legend=str(language), size=10, line_color=colors.pop(),  source=source)

–

You received this message because you are subscribed to the Google Groups “Bokeh Discussion - Public” group.

To unsubscribe from this group and stop receiving emails from it, send an email to bokeh+un...@continuum.io.

To post to this group, send email to bo...@continuum.io.

To view this discussion on the web visit https://groups.google.com/a/continuum.io/d/msgid/bokeh/71a2ed03-eb26-4e79-858d-abfcd428481a%40continuum.io.

For more options, visit https://groups.google.com/a/continuum.io/d/optout.

–

You received this message because you are subscribed to the Google Groups “Bokeh Discussion - Public” group.

To unsubscribe from this group and stop receiving emails from it, send an email to bokeh+un...@continuum.io.

To post to this group, send email to bo...@continuum.io.

To view this discussion on the web visit https://groups.google.com/a/continuum.io/d/msgid/bokeh/CA%2BEr%2BdRLSXDQVYZutw3JQSEAJo%3DEHFRJPLKaxN%3DO_U-NJNqh1g%40mail.gmail.com.

For more options, visit https://groups.google.com/a/continuum.io/d/optout.

–

You received this message because you are subscribed to the Google Groups “Bokeh Discussion - Public” group.

To unsubscribe from this group and stop receiving emails from it, send an email to bokeh+un...@continuum.io.

To post to this group, send email to bo...@continuum.io.

To view this discussion on the web visit https://groups.google.com/a/continuum.io/d/msgid/bokeh/1C7489F5-90E5-48F6-A10D-D0DA155A58A6%40continuum.io.
For more options, visit https://groups.google.com/a/continuum.io/d/optout.

–

You received this message because you are subscribed to the Google Groups “Bokeh Discussion - Public” group.

To unsubscribe from this group and stop receiving emails from it, send an email to bokeh+un...@continuum.io.

To post to this group, send email to bo...@continuum.io.

To view this discussion on the web visit https://groups.google.com/a/continuum.io/d/msgid/bokeh/661416b3-79c3-4e35-a8d9-bd98eb594460%40continuum.io.

For more options, visit https://groups.google.com/a/continuum.io/d/optout.

⌁   Link to post

End of archived discussion · Replies are disabled