☰Read-only archive⌕
Looking for help with Bokeh?

This is a read-only archive. Ask questions and join the conversation on GitHub.

Visit Community Support on GitHub →
Archived discussions · Captured October 28, 2026

Interactively Set Render Order

Community Supportglyphrenderercustomjsbokehjs
Eric_Johnson
Eric_Johnson

Hi there,
The user needs to be able to change the order of renderers instead of just click them on and off. Ideally they could simply drag and drop their order in the legend, which would then change the render order in the plot. Does Bokeh have an option like this?

Ive tried re-ordering with a button (see MRE below). But i would like the user to be able to set each render order instead of a basic swap like this.

def MakePLot():
    from bokeh.plotting import figure
    import numpy as np

    # Generate random data
    x = np.random.random(size=100) * 10
    y = np.random.random(size=100) * 10
    y1 = np.random.random(size=100) * 10
    y2 = y1 + np.random.uniform(1, 3, size=100)

    p = figure(width=800, height=250)
    p.title.text = 'Click on legend entries to hide the corresponding lines'

    # Add scatter and area glyphs
    scatter = p.scatter(x, y, color='blue', legend_label='blue scatter', name="Blue Points")
    scatter = p.scatter(x*1.1, y*0.9, color='green', size=15, legend_label='green scatter', name="Green Points")
    area = p.varea(x=x, y1=y1, y2=y2, fill_color='red', legend_label='area', name="Red Area")
    
    p.legend.location = "top_left"
    p.legend.click_policy="hide"
    
    return p


def Add_Render_Order_Button(p):
    from bokeh.models import CustomJS, Button
    # JavaScript code to reorder the renderers list
    code = """
        var reorderedRenderers = [plot.renderers[2], plot.renderers[1], plot.renderers[0]];
        plot.renderers = reorderedRenderers;
    """

    callback = CustomJS(args=dict(plot=p), code=code)

    button = Button(label="Swap Red Area Render Order with Points", button_type="success")
    button.js_on_click(callback)
    
    return button


from bokeh.layouts import column
from bokeh.plotting import show, output_notebook

p = MakePLot()
button = Add_Render_Order_Button(p)

output_notebook()
layout = column(button, p)
show(layout)

Cheers,
Eric

⌁   Link to post
gmerritt123
gmerritt123

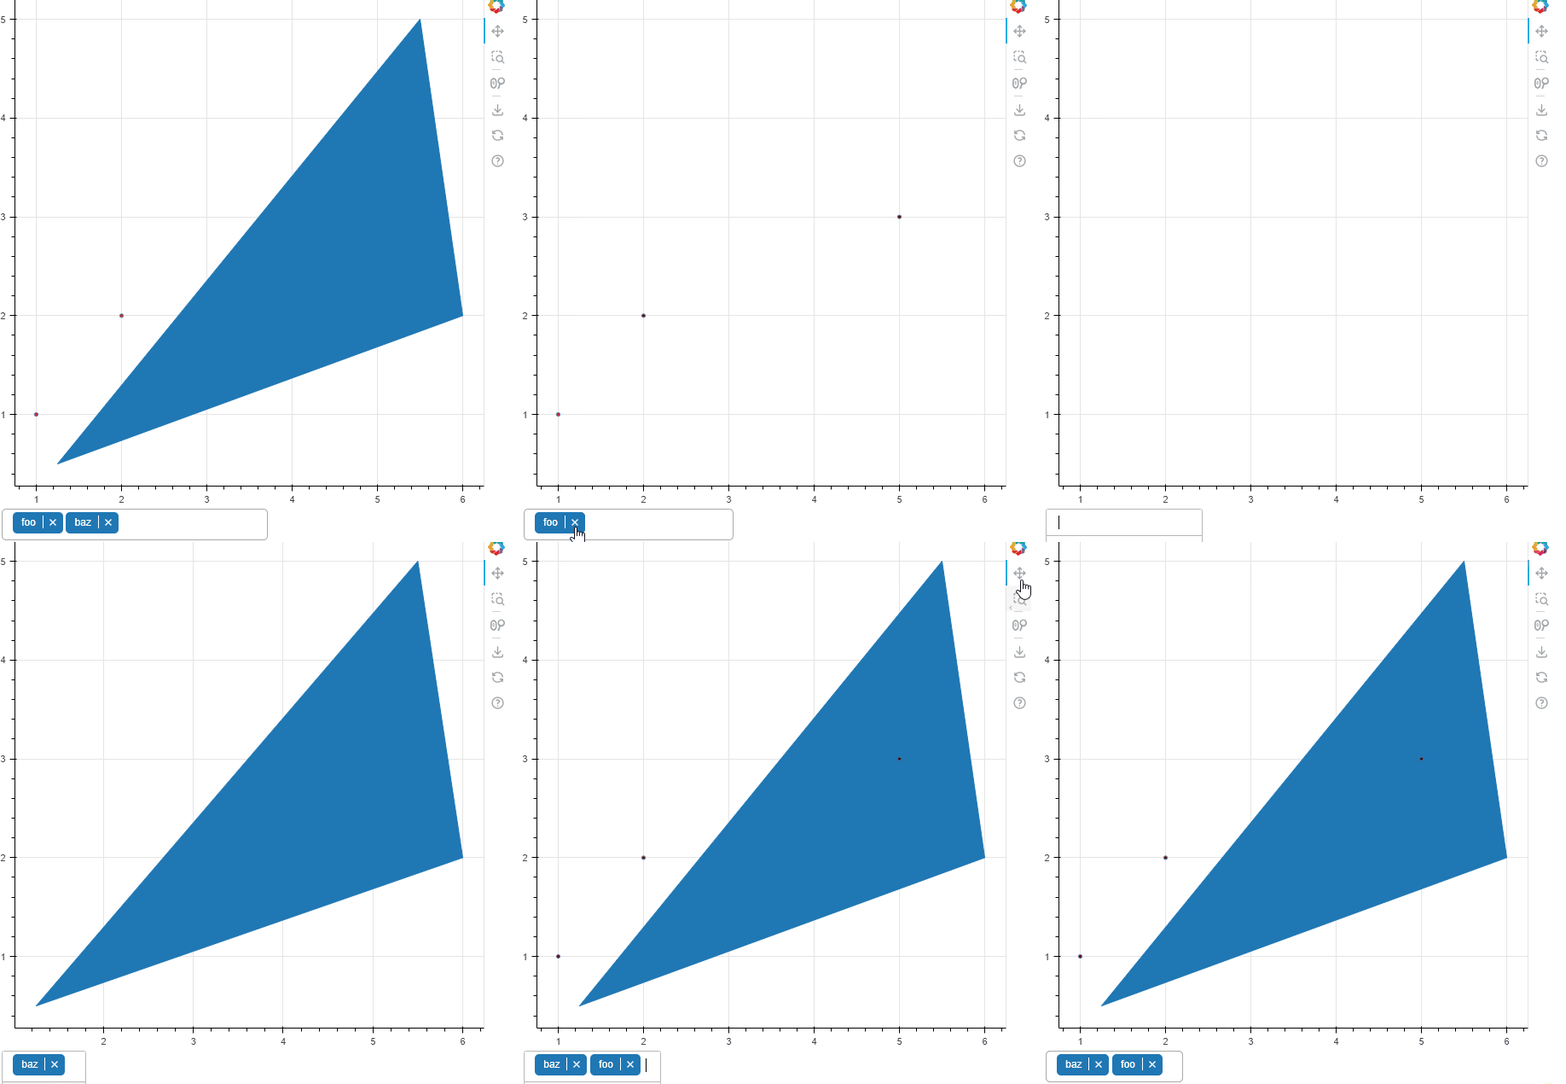
It’s a little clunky but you could use MultiChoice:

from bokeh.plotting import figure,show
from bokeh.models import CustomJS, MultiChoice
from bokeh.layouts import column

f = figure()
f.scatter(x=[1,2,5],y=[1,2,3],fill_color='red')
f.patches(xs=[[1.25,5.5,6]],ys=[[0.5,5,2]])

OPTIONS = ["foo", "baz"]
rend_dict = {OPTIONS[i]:x for i,x in enumerate(f.renderers)}

multi_choice = MultiChoice(value=["foo", "baz"], options=OPTIONS)

cb = CustomJS(args=dict(rend_dict=rend_dict,multi_choice=multi_choice,f=f)
              ,code='''
              console.log(multi_choice.value)
              console.log(f.renderers)
              f.renderers = multi_choice.value.map(v=>rend_dict[v])
              console.log(f.renderers)
              '''
              )
multi_choice.js_on_change("value",cb)
lo = column([f,multi_choice])
show(lo)

Idea is you map the multichoice values to a particular renderer, then when multichoice values change, update the renderers on the figure to be consistent with the order of the multichoice.

r_order

I always wished the multichoice widget could let user rearrange the values, but reading about choices.js (the library multichoice runs on) it looks like it’s not built in.

⌁   Link to post
nmasnadi
nmasnadi

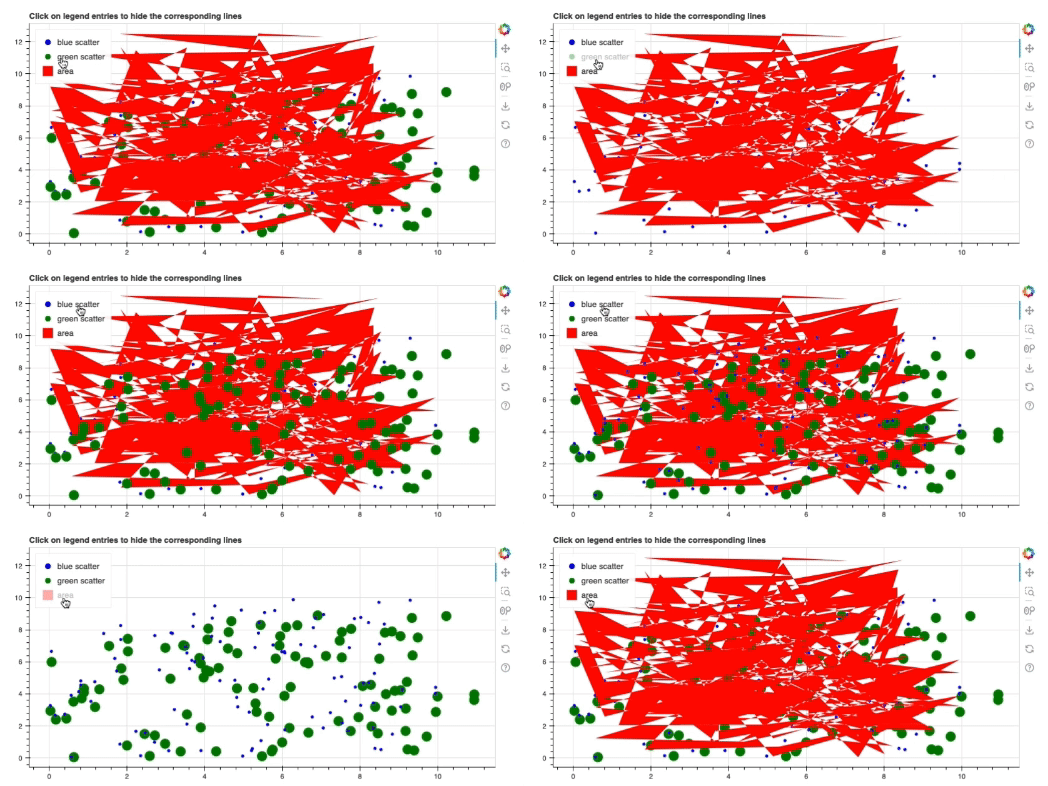
Here is another solution using the interactive legends. Basically if the user wants to bring a certain item to the forefront, they need to click on the legend once to hide it and click again to unhide it and then it will appear on top.

from bokeh.layouts import column
from bokeh.plotting import show, output_notebook
from bokeh.models import CustomJS, Button

def MakePLot():
    from bokeh.plotting import figure
    import numpy as np

    # Generate random data
    x = np.random.random(size=100) * 10
    y = np.random.random(size=100) * 10
    y1 = np.random.random(size=100) * 10
    y2 = y1 + np.random.uniform(1, 3, size=100)

    p = figure(width=800, height=400)
    p.title.text = 'Click on legend entries to hide the corresponding lines'

    # Add scatter and area glyphs
    renderers = []
    renderers.append(p.scatter(x, y, color='blue', legend_label='blue scatter', name="Blue Points"))
    renderers.append(p.scatter(x*1.1, y*0.9, color='green', size=15, legend_label='green scatter', name="Green Points"))
    renderers.append(p.varea(x=x, y1=y1, y2=y2, fill_color='red', legend_label='area', name="Red Area"))
    
    p.legend.location = "top_left"
    p.legend.click_policy="hide"

    code = """
    if (cb_obj.visible == true) {
        let new_renderers = []
        let idx
        for (let i=0; i < p.renderers.length; i++) {
            if (p.renderers[i].name != name) {
                new_renderers.push(p.renderers[i])
            } else {
                idx = i
            }
        }
        new_renderers.push(p.renderers[idx])
        p.renderers = new_renderers
    }
    """
    for renderer in renderers:
        renderer.js_on_change('visible', CustomJS(args={'p': p, 'name': renderer.name}, code=code))
    
    return p

p = MakePLot()

output_notebook()
show(p)

Screen Recording 2024-05-30 at 8.49.39 PM

⌁   Link to post

End of archived discussion · Replies are disabled