☰Read-only archive⌕
Looking for help with Bokeh?

This is a read-only archive. Ask questions and join the conversation on GitHub.

Visit Community Support on GitHub →
Archived discussions · Captured October 28, 2026

Is it possible to add a toggle or button to switch between only data from last N points VS all the data

Community Supporttime-seriesbokeh
DenisU
DenisU

Hello,

I am new to bokeh and I try to add a way to change how time-series data is displayed in a figure.
Is it possible to add a toggle or button to switch between only data from last N points VS all the data.

I can’t find any information about is and I am wondering if someone already tried / found a way?
Thanks

⌁   Link to post
gmerritt123
gmerritt123

If it’s a relatively simple application, you could use a numericinput — Bokeh 3.7.2 Documentation ,and a button of your choosing → buttons — Bokeh 3.7.2 Documentation as widgets. Then use a CDSView and IndexFilter on your renderer, and use CustomJS to adjust the indices property of the IndexFilter based on the widget states (i.e. the value in the numeric input and whether the selected button says “show all data” or “show n last points”. Have this CustomJS execute when either widget value changes. See Data sources — Bokeh 3.7.2 Documentation .

I can help, if you can post a Minimal Reproducible Example with what you’ve tried.

⌁   Link to post
DenisU
DenisU

Thank you very much!

For instance, on such a figure, with your help I could add the buttons, but I have no idea how to center those buttons and make them show: last week / last month / last year:

import numpy as np

from bokeh.layouts import column
from bokeh.models import ColumnDataSource, RangeTool, RadioButtonGroup, CustomJS
from bokeh.plotting import figure, show
from bokeh.sampledata.stocks import AAPL

dates = np.array(AAPL['date'], dtype=np.datetime64)
source = ColumnDataSource(data=dict(date=dates, close=AAPL['adj_close']))

p = figure(height=300, width=800, tools="xpan,xwheel_zoom,reset",
           x_axis_type="datetime", x_axis_location="above", window_axis="x",
           background_fill_color="#efefef", x_range=(dates[1500], dates[2500]))

p.line('date', 'close', source=source)
p.yaxis.axis_label = 'Price'

select = figure(title="Drag the middle and edges of the selection box to change the range above",
                height=130, width=800,
                x_axis_type="datetime", y_axis_type=None,
                tools="", toolbar_location=None, background_fill_color="#efefef")
select.x_range.range_padding = 0
select.x_range.bounds = "auto"

range_tool = RangeTool(x_range=p.x_range, start_gesture="pan")
range_tool.overlay.fill_color = "navy"
range_tool.overlay.fill_alpha = 0.2

select.line('date', 'close', source=source)
select.ygrid.grid_line_color = None
select.add_tools(range_tool)

radio_button_group = RadioButtonGroup(labels=["Week", "Month", "Year"], active=0, width=100, max_height=30)
radio_button_group.js_on_event("button_click", CustomJS(code="console.log('radio_button_group: active=' + this.origin.active, this.toString())"))

show(column(
    children=[p, select, radio_button_group],
    sizing_mode='stretch_both'))

Thanks

⌁   Link to post
Bryan
Bryan

I have no idea how to center those buttons and make them show: last week / last month / last year:

@DenisU can you take a look at the docs and example for IndexFilter and see if that suggest details for how to implement @gmerritt123 suggestion?

https://docs.bokeh.org/en/latest/docs/user_guide/basic/data.html#indexfilter

Assuming there is one data point per day, and the data is in ascending date order, then the configuration for the “last 30 days” would just be a list of the last 30 indices into the column. E.g. if you have 1000 data points total, that would be a list of integers from 970 to 999.

⌁   Link to post
DenisU
DenisU

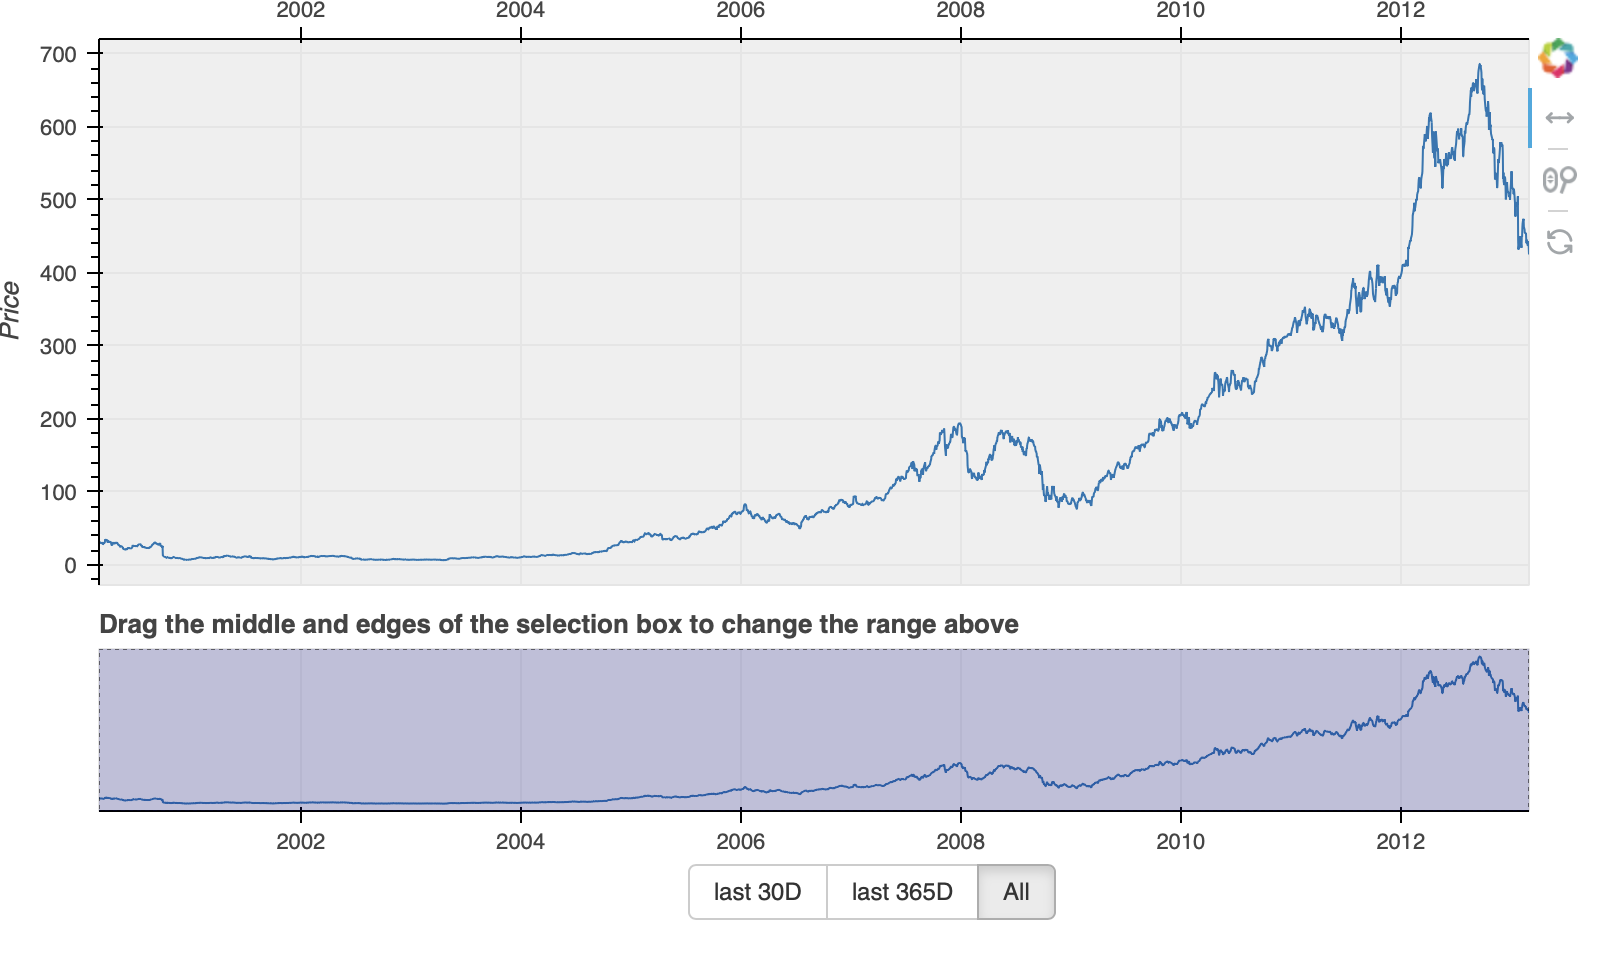
I finally found a way to make buttons work.
Now I just don’t know how to horizontally center buttons, does anyone knows how to do it? I tried with align=center for RadioButtonGroup but it does not work.

import numpy as np

from bokeh.layouts import column
from bokeh.models import ColumnDataSource, RangeTool, RadioButtonGroup, CustomJS
from bokeh.plotting import figure, show
from bokeh.sampledata.stocks import AAPL

dates = np.array(AAPL['date'], dtype=np.datetime64)
source = ColumnDataSource(data=dict(date=dates, close=AAPL['adj_close']))

p = figure(height=300, width=800, tools="xpan,xwheel_zoom,reset",
           x_axis_type="datetime", x_axis_location="above", window_axis="x",
           background_fill_color="#efefef", x_range=(dates[0], dates[-1]))

p.line('date', 'close', source=source)
p.yaxis.axis_label = 'Price'

select = figure(title="Drag the middle and edges of the selection box to change the range above",
                height=130, width=800,
                x_axis_type="datetime", y_axis_type=None,
                tools="", toolbar_location=None, background_fill_color="#efefef")
select.x_range.range_padding = 0
select.x_range.bounds = "auto"

range_tool = RangeTool(x_range=p.x_range, start_gesture="pan")
range_tool.overlay.fill_color = "navy"
range_tool.overlay.fill_alpha = 0.2

select.line('date', 'close', source=source)
select.ygrid.grid_line_color = None
select.add_tools(range_tool)

radio_button_group = RadioButtonGroup(labels=["last 30D", "last 365D", "All"], active=2, width=100, max_height=30)
radio_button_group.js_on_event(
    "button_click", 
    CustomJS(
	args=dict(source=source, p=p),
        code="""
	console.log('radio_button_group: active=' + this.origin.active, this.toString());
	const data = source.data;
	const last = new Date(data["date"][data["date"].length-1]);
	console.log('last '+last);
	const first = new Date(data["date"][0]);
	console.log('first '+first);
	const mid = new Date(last);
	if(this.origin.active == 0) {
		mid.setTime(mid.getTime() - (24*60*60*1000) * 30);
	} else if (this.origin.active == 1) {
		mid.setTime(mid.getTime() - (24*60*60*1000) * 365);
	} else {
		mid.setTime(first.getTime());
	}
	console.log('mid '+mid);
	p.x_range.start = Date.parse(mid.toDateString());
    	p.x_range.end = Date.parse(last.toDateString());
    	p.x_range.change.emit();
	"""
    )
)

show(column(
    children=[p, select, radio_button_group],
    sizing_mode='stretch_both'))

⌁   Link to post
Bryan
Bryan

It’s not really clear what you are after precisely. For example you set "stretch_both" on the column but gave fixed widths for the plot, which is not really a useful combination. If you actually want the fixed widths then this works:

buttons = row(radio_button_group, align="center")
show(column(
    children=[p, select, buttons],
    sizing_mode='stretch_height'))

It works with the original "stretch_both" too, actually, but then the buttons are centered on the entire page, because you asked the parent column to take up the full width.

⌁   Link to post
DenisU
DenisU

Thanks @Bryan, it’s good to know that I can do this with the row element.
I found another way to center the RadioButtonGroup, using css, and I added the "stretch_both" to all children in the column.
I also could change the font-size of the labels in the RadioButtonGroup:

centered_rbg = InlineStyleSheet(css="""
:host(.custom_RBG) {
    display: block;
    margin-left:auto;
    margin-right:auto;
}
""")
radio_button_group = RadioButtonGroup(labels=["last 30D", "last 365D", "All"], active=2, width=100, max_height=50, stylesheets = [centered_rbg], css_classes=['custom_RBG'], css_variables={'font-size': '20px'})

Thanks!

⌁   Link to post
Bryan
Bryan

@DenisU That’s great! Can you start by making a GitHub Issue about adding this example with a link to this thread? I’m torn as to whether this would best go under examples/basic/data (since it deals with CDSView) or examples/interaction (since is relies on CustomJS and widgets) and I’d like to poll some other core devs.

Once that’s settled, the simplest thing will just be to add a streamlined version that matches the coding style of existing examples. Then if you want to continue further (up to you) we can talk about adding to the gallery, linking from the user guide, etc.

⌁   Link to post
DenisU
DenisU

@Bryan thanks, before that, I would like to solve this issue:

As I would like to make “All” active from the RadioButtonGroup, when the “ResetTool” button from the figure toolbar is clicked.

⌁   Link to post

End of archived discussion · Replies are disabled