Hello!
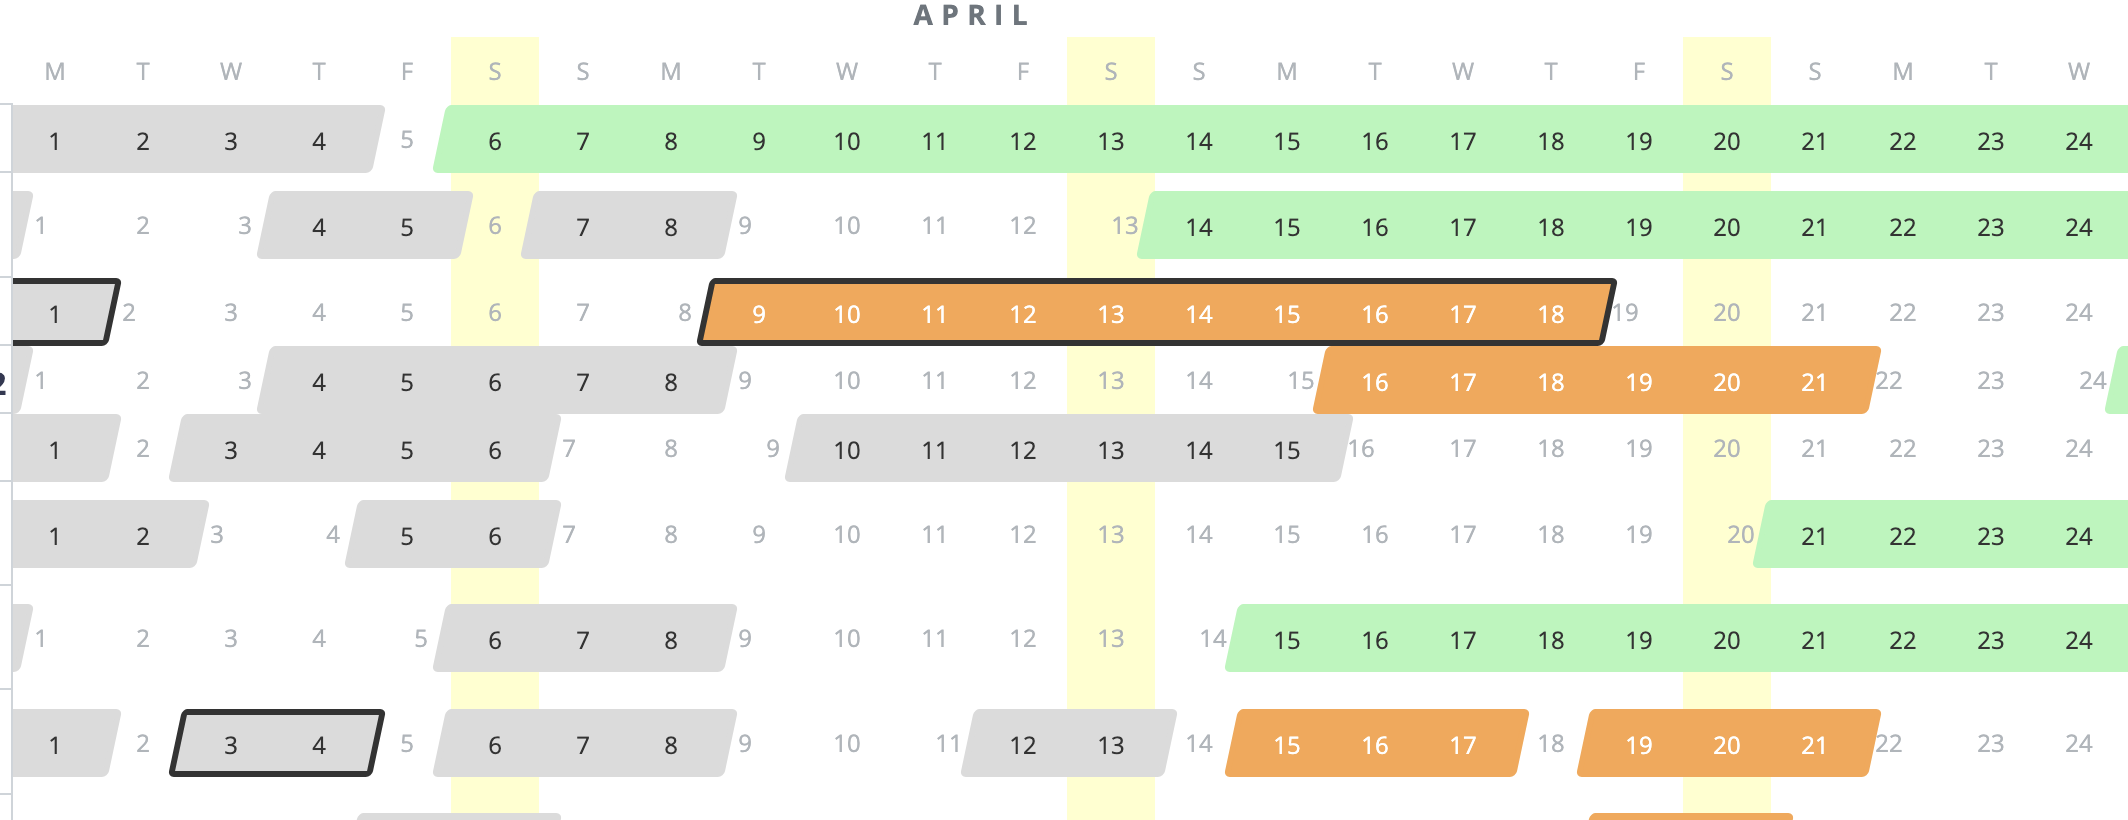
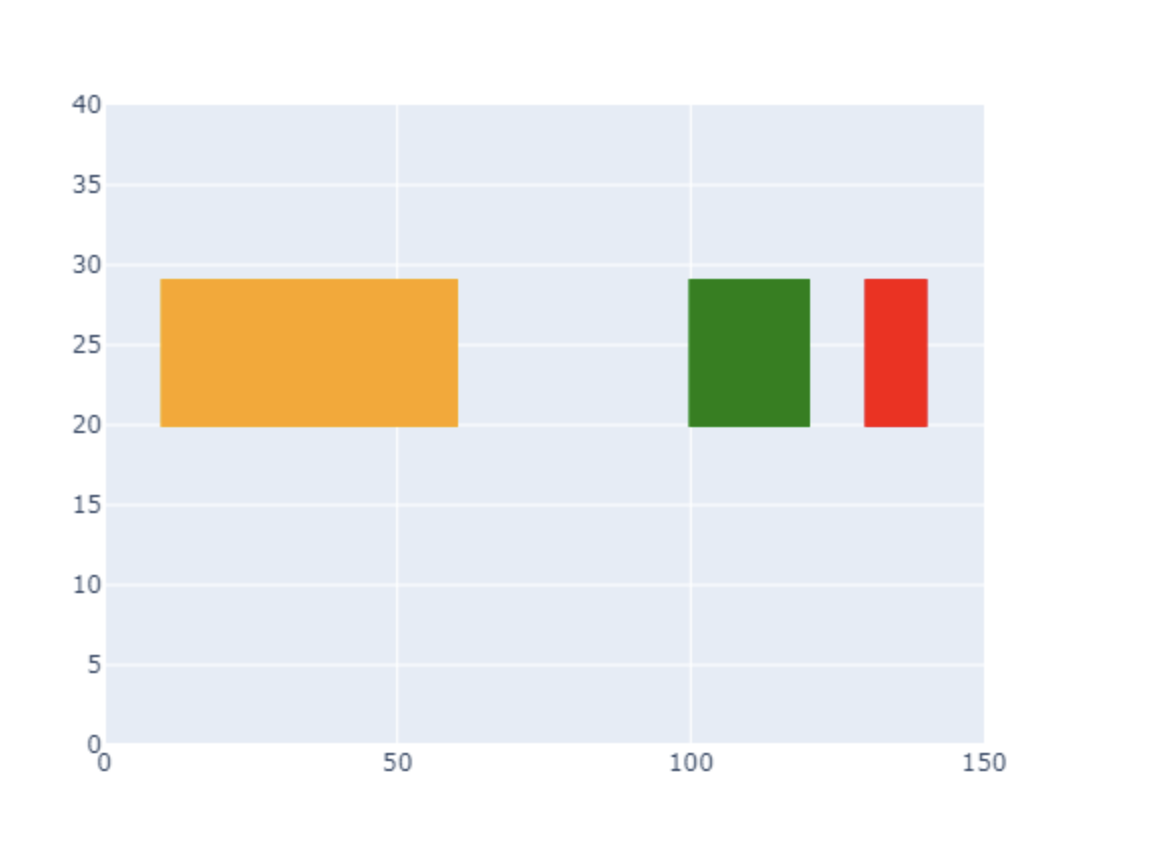
I am trying to make a stacked horizontal bar chart similar to the below screen shot. Categories for the y-axis, with start and end dates for events defining the bars. There can be gaps between events, so there would be “emptiness” between some events, hence “broken” bars.
What do you think? How would you go about making something like this? Thank you in advance.