

I have a dense graph, but similar to the source you provided here. when I hover on top of multiple points, it will show images in a strip (as seen below).
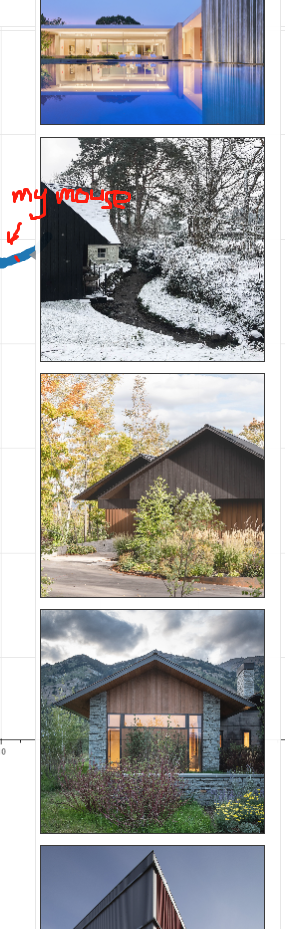
the current code I’m using within the tooptips are
TOOLTIPS = """
    <div>
        <div>
            <img
                src="@imgs" height="300" alt="@imgs" width="300"
                style="float: left; margin: 0px 15px 15px 0px;"
                border="1"
            ></img>
        </div>
    </div>
"""
Is it possible to customize how the image will appear? like plotting the image in a grid, and only showing the first 6 images underlying the overlapping point.
It might not be a question with bokeh but more like an HTML question? not sure where is a good place to put it.

