

☰Read-only archive⌕
Looking for help with Bokeh?

This is a read-only archive. Ask questions and join the conversation on GitHub.

Visit Community Support on GitHub →
Archived discussions · Captured October 28, 2026

Is pushing data to a second source using a button possible?

Community Support
Eric_Johnson
Eric_Johnson

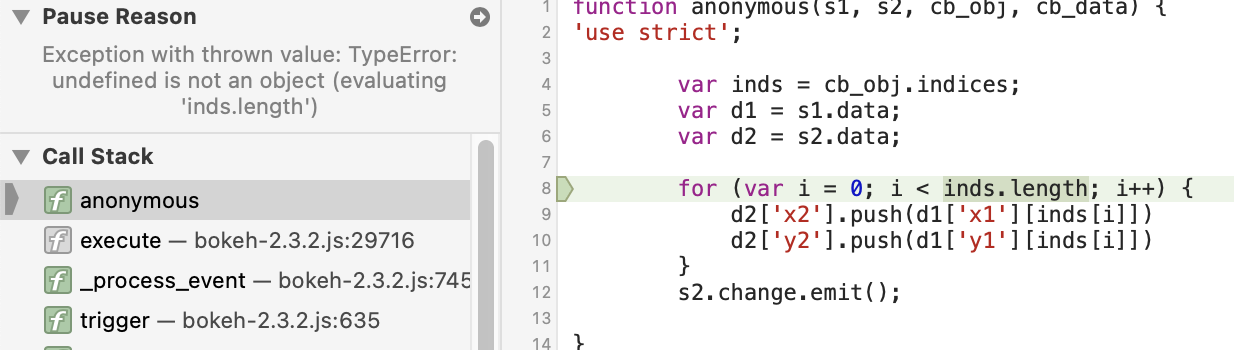
This code works if you set the callback to the selected on change. But what i want is the ability to select points then push it to another source, only if the button is pressed. But js_on_click only takes 2 positional arguments. Is it not possible to push data to another source with a button click?

from bokeh.io import output_file, show
from bokeh.layouts import row
from bokeh.models import ColumnDataSource, CustomJS, Button, TableColumn, DataTable
from bokeh.plotting import figure, output_notebook

output_notebook()

x1 = list(range(-20, 21))
y1 = [abs(xx) for xx in x]


# create a column data source for the plots to share
s1 = ColumnDataSource(data=dict(x1=x1, y1=y1))
s2 = ColumnDataSource(data=dict(x2=[], y2=[]))

TOOLS = "box_select,lasso_select,help"

# create a new plot and add a renderer
left = figure(tools=TOOLS, plot_width=300, plot_height=300, title=None)
left.circle(x='x1', y='y1', source=s1)

# create another new plot and add a renderer
right = figure(tools=TOOLS, plot_width=300, plot_height=300, title=None)
right.circle(x='x2', y='y2', source=s2)

callback = """
        var inds = cb_obj.indices;
        var d1 = s1.data;
        var d2 = s2.data;
        
        for (var i = 0; i < inds.length; i++) {
            d2['x2'].push(d1['x1'][inds[i]])
            d2['y2'].push(d1['y1'][inds[i]])
        }
        s2.change.emit();

    """


s1.selected.js_on_change('indices', CustomJS(args=dict(s1=s1, s2=s2)))

columns = [TableColumn(field ='x2', title = "x2"),
           TableColumn(field ='y2', title = "y2")
                       ]


table = DataTable(source=s2,
                  columns=columns,
                  width=200,
                  height=300,
                 )

PushButton = Button(label="Push", width=80)
PushButton.js_on_click('indices', CustomJS(args=dict(s1=s1, s2=s2),code=callback))

p = row(PushButton, left, right, table)

show(p)


⌁   Link to post
Bryan
Bryan

@Eric_Johnson There are a few problems with your code:

  • x is undefined (presumably a typo and you meant x1)

  • js_on_click only takes the callback object as its only parameter

  • The CustomJS callback is on the Button, so the value of cb_obj (short for “callback object”) is the button. A button has not indices property. You want

    const inds = s1.selected.indices
    
  • Generally speaking, it’s good to avoid var (prefer const or let if necessary)

With those small changes, your code works for me.

⌁   Link to post
carolyn
carolyn

I changed a couple things to get your code working as-is. Let me know if this is what you’re looking for. Note that this won’t clear the previously selected points from s2, so you might want to add that in.

from bokeh.io import show
from bokeh.layouts import row
from bokeh.models import ColumnDataSource, CustomJS, Button, TableColumn, DataTable
from bokeh.plotting import figure

x1 = list(range(-20, 21))
y1 = [abs(xx) for xx in x1]

# create a column data source for the plots to share
s1 = ColumnDataSource(data=dict(x1=x1, y1=y1))
s2 = ColumnDataSource(data=dict(x2=[], y2=[]))

TOOLS = "box_select,lasso_select,help"

# create a new plot and add a renderer
left = figure(tools=TOOLS, plot_width=300, plot_height=300, title=None)
left.circle(x='x1', y='y1', source=s1)

# create another new plot and add a renderer
right = figure(tools=TOOLS, plot_width=300, plot_height=300, title=None)
right.circle(x='x2', y='y2', source=s2)

callback = """
        var d1 = s1.data;
        var d2 = s2.data;
        var inds = s1.selected.indices;

        for (var i = 0; i < inds.length; i++) {
            d2['x2'].push(d1['x1'][inds[i]])
            d2['y2'].push(d1['y1'][inds[i]])
        }
        s2.change.emit();

    """
PushButton = Button(label="Push", width=80)
PushButton.js_on_click(CustomJS(args=dict(s1=s1, s2=s2), code=callback))

columns = [TableColumn(field='x2', title="x2"),
           TableColumn(field='y2', title="y2")
           ]

table = DataTable(source=s2,
                  columns=columns,
                  width=200,
                  height=300,
                  )
p = row(PushButton, left, right, table)

show(p)
⌁   Link to post
Eric_Johnson
Eric_Johnson

Yes this works, thanks! I was looking for a way the user can select some points, add them to a new source, look around and select some other points again then add those points to the source, etc. Without clearing them from s2.

If anyone is wondering about clearing the previously selected point, in the callback before the for loop, just add:

d2[‘x2’] = [ ]
d2[‘y2’] = [ ]

⌁   Link to post

End of archived discussion · Replies are disabled