

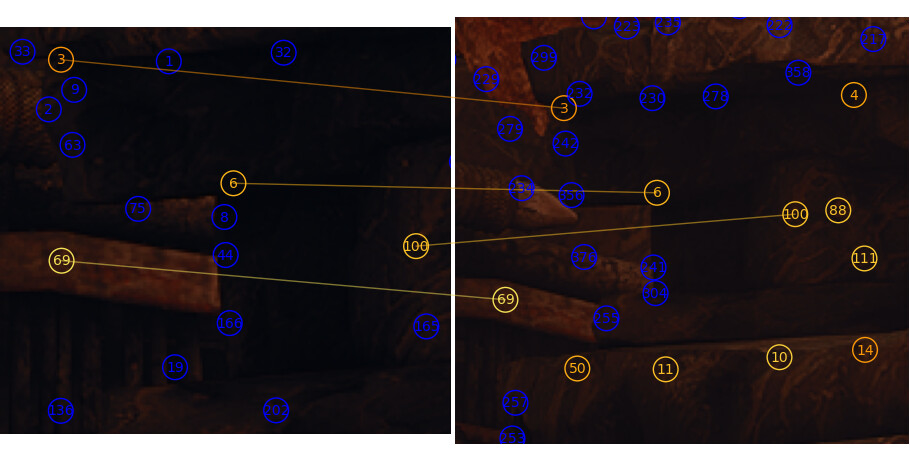
I am working on keypoints matching and trying to reproduce the visualization I did with matplotlib.
Is there a way to draw a line between two keypoints from two different plots similar to ConnectionPatch?
What I did so far with Bokeh is to plot both images in the same plot and draw all the connections there, but this does not allow me to zoom in targetting the same region for both images.
Attached the plot I draw with matplotlib


 But there’s never been a concrete demand, and always other priorities. I don’t actually think there is an issue for this, can you make a
