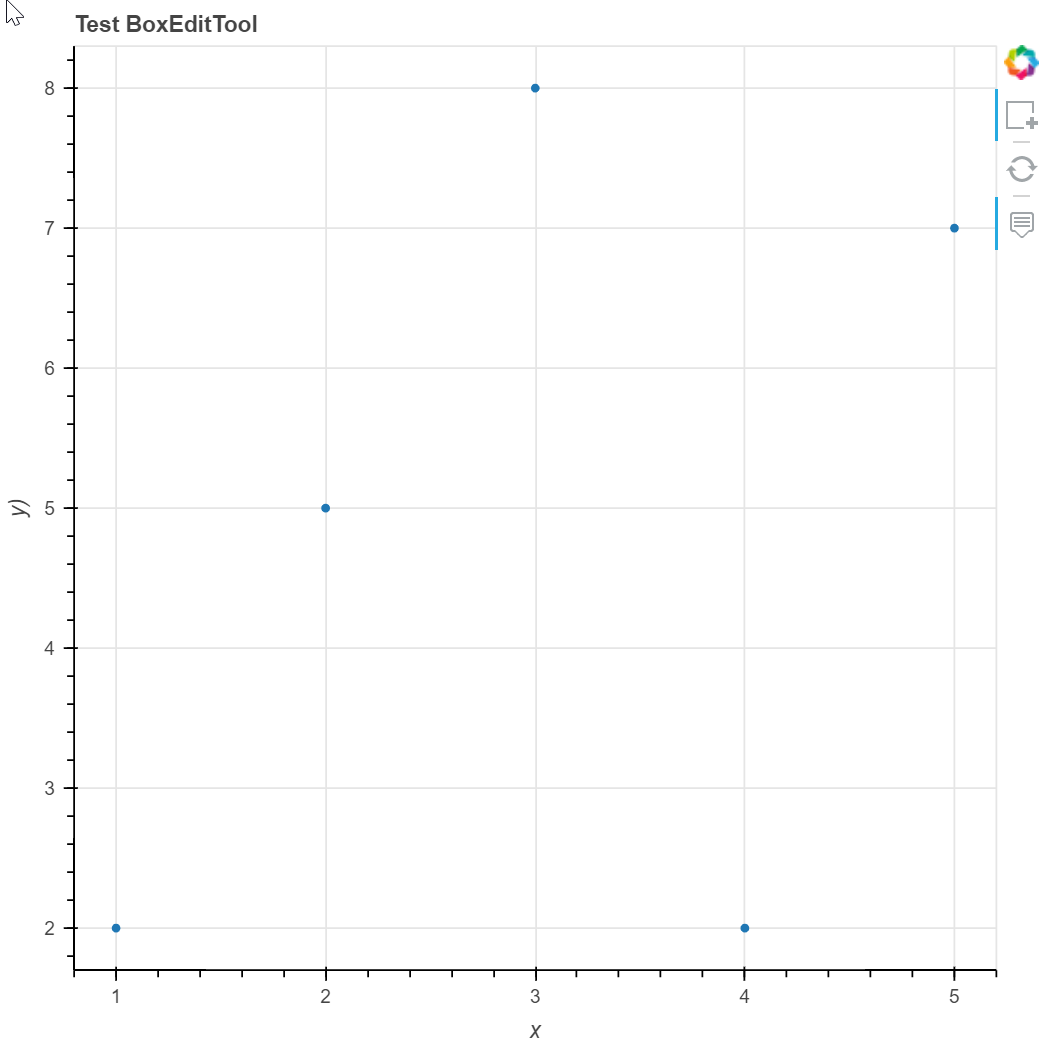
I have the following Jupyter Lab server app for the use of BoxEditTool which won’t show the rectangle even when pressing the shift key. The rectangle shows if I output that to an html file. I adapted this example to a Jupyter server app after this SO example:
from bokeh.plotting import figure
from bokeh.layouts import column
from bokeh.models import ColumnDataSource, BoxEditTool
from bokeh.io import show, output_notebook
output_notebook()

def bkapp(doc):

    data = ColumnDataSource(data=dict(
    x0=[1, 2, 3, 4, 5],
    y0=[2, 5, 8, 2, 7],
    ))

    tools = ['hover', 'reset']

    plot = figure(x_axis_label='x',
                  y_axis_label='y)',
                  title="Test BoxEditTool",
                  tools=tools)

    source1 = ColumnDataSource({'x':[], 'y':[], 'width':[], 'height':[]})
    r1 = plot.rect('x', 'y', 'width', 'height', source=source1)
    tool = BoxEditTool(renderers=[r1], num_objects=1)
    plot.add_tools(tool)

    # Add the data renderer (here a scatter plot)
    scatter = plot.scatter(x='x0', y='y0', source=data)

    doc.add_root(column(plot))

show(bkapp)