☰Read-only archive⌕
Looking for help with Bokeh?

This is a read-only archive. Ask questions and join the conversation on GitHub.

Visit Community Support on GitHub →
Archived discussions · Captured October 28, 2026

Label on y axis tick label area

Community Support
Hora_O
Hora_O

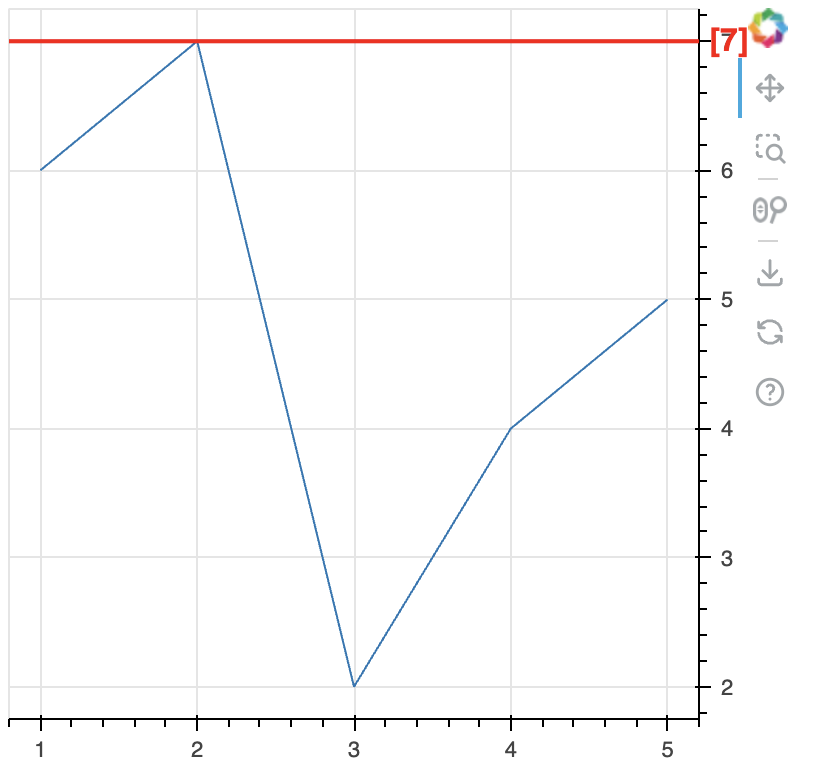
I am trying to lay the Label on y axis tick label area for solving the problem below.
https://discourse.bokeh.org/t/html-rendering-in-customjstickformatter/11988

When I tried to lay the Label on that area, the Label was underlaid and did’t show. I added the level=‘overlay’ on the Label but no effect.

I happened to discover when I used add_layout(label, ‘below’), it showed.
I am wondering why it shows by that way. ‘below’, ‘above’, ‘left’ have the effect on showing, but ‘center’, ‘right’ are of no effect.

But when I used LabelSet instead of Label, the add_layout trick didn’t work.
Moreover when I applied add_layout(label, ‘below’) on my real chart module, that broke the layout of my chart.

What is the right way to lay the label on axis tick label area?

from bokeh.plotting import figure, show
from bokeh.models import Label, Span

x = [1, 2, 3, 4, 5]
y = [6, 7, 2, 4, 5]

p = figure(width=400, height=400, y_axis_location="right")

p.line(x, y)

hline_value = 7  
hline = Span(location=hline_value, dimension='width', line_color='red', line_width=2)
p.add_layout(hline)

label = Label(x=400-40, y=hline_value, text="[%d]" % hline_value, y_units="data", x_units="screen",
                level='overlay',
                text_align="center", text_baseline="middle", 
                text_font_size="12pt", text_color="red", text_font_style="bold")
p.add_layout(label, 'below')

show(p)

⌁   Link to post
Jonas_Grave_Kristens

@Hora_O Maybe the use of floating UI element can be used in this case. I do not have any experience with this but there is a description on GitHub where @mateusz has implemented this in Bokeh.
https://github.com/bokeh/bokeh/blob/branch-3.6/src/bokeh/models/ui/panels.py

The examples he refers to are here:
https://github.com/bokeh/bokeh/tree/branch-3.6/examples/basic/ui

So in your case add something like:

from bokeh.models import Node, Panel, XY
from bokeh.models.dom import HTML

label = Panel(
    position=XY(x=5.1, y=7),
    anchor="center_left",
    css_variables={
        "--max-width": Node(target="frame", symbol="width"),
    },
    stylesheets=["""
:host {
  padding: 2px;
  background-color: rgba(211, 211, 211, 0.7);
  font-size: 12px;
  white-space: nowrap;
  overflow: hidden;
  text-overflow: ellipsis;
  max-width: var(--max-width);
}
"""],
    elements=[
        HTML(f"[{hline_value}]"),
    ],
)
p.elements.append(label)

Screenshot from 2024-09-26 08-58-18

⌁   Link to post
Bryan
Bryan

What is the right way to lay the label on axis tick label area?

There’s not any currently “accepted” practice for this that I am aware. There may be way to use some components in unorthodox ways to achieve something like this, as demonstrated above.

cc @mateusz for any thoughts (either on current capability I have just missed, or any potential future plans)

⌁   Link to post

End of archived discussion · Replies are disabled