
☰Read-only archive⌕
Looking for help with Bokeh?

This is a read-only archive. Ask questions and join the conversation on GitHub.

Visit Community Support on GitHub →
Archived discussions · Captured October 28, 2026

Labels not rendering.- getting error 'could not find tag with id...'

Community Support
Kasia_Rachuta
Kasia_Rachuta

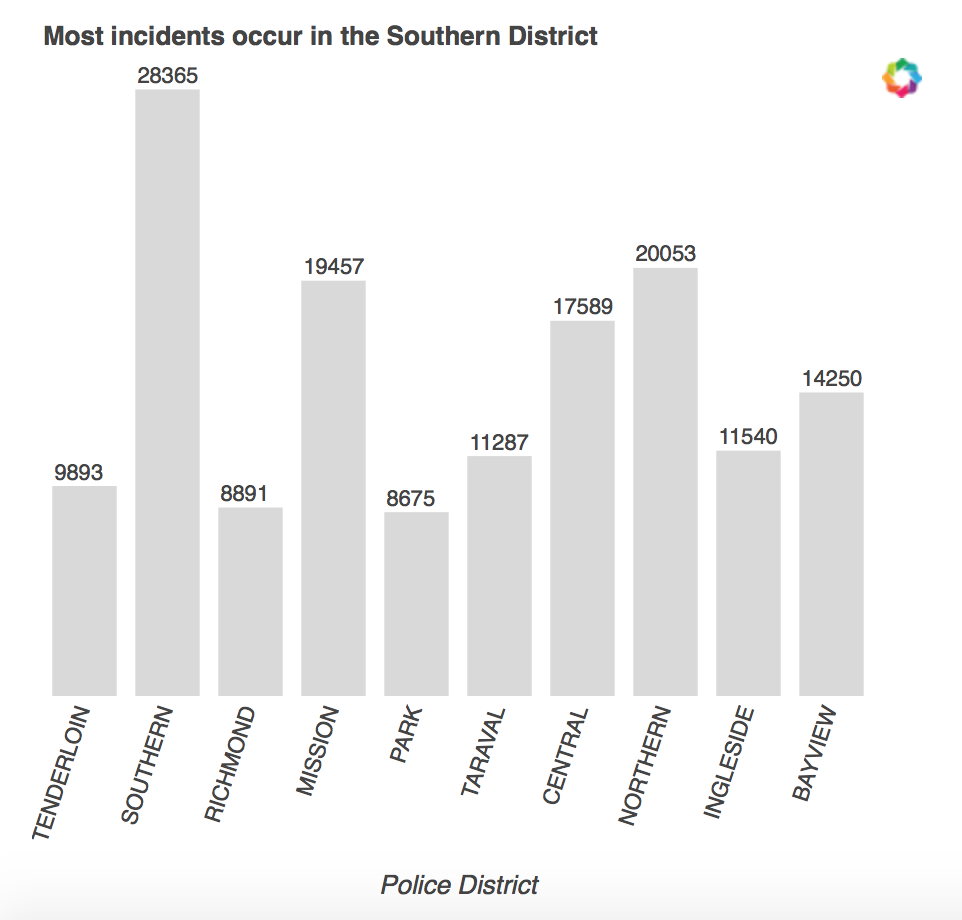
I’m trying to create a bar chart with labels above the bars (something like the screenshot attached). Now I’m re-using the code with a different data frame (data, although labels come from a different one that’s already aggregated) Underneath is my code which gives me the following error: "Javascript error adding output!
Error: Error rendering Bokeh model: could not find tag with id: 8c51aaa0-128b-4f6c-814f-b44d021a83cd

See your browser Javascript console for more details."

bar charts by vertical

source = ColumnDataSource(verticals)

p = Bar(data, values=‘vertical’, label=‘vertical’, agg=‘count’,

fill_alpha=0.3, outline_line_alpha=0, line_color=‘white’, notebook=True, tools=False,

color=‘grey’)

p.legend.location = None

p.title.text = ‘Most attempts come from X vertical’

labels = LabelSet(x=‘vertical’, y=‘count’, text=‘count’, level=‘glyph’,

x_offset=5, y_offset=5, source=source, render_mode=‘canvas’, text_font_size=“8pt”)

p.axis.minor_tick_in = 0

p.axis.minor_tick_out = 0

p.axis.major_tick_in = 0

p.axis.major_tick_out = 0

p.xgrid.grid_line_color = None

p.ygrid.grid_line_color = None

p.add_layout(labels)

show(p)
⌁   Link to post
Kasia_Rachuta
Kasia_Rachuta

Update: It renders when I restart the Jupyter notebook. It literally just shows up. I have no idea why.

···

On Tuesday, 4 April 2017 14:52:42 UTC-7, Kasia Rachuta wrote:

I’m trying to create a bar chart with labels above the bars (something like the screenshot attached). Now I’m re-using the code with a different data frame (data, although labels come from a different one that’s already aggregated) Underneath is my code which gives me the following error: "Javascript error adding output!
Error: Error rendering Bokeh model: could not find tag with id: 8c51aaa0-128b-4f6c-814f-b44d021a83cd

See your browser Javascript console for more details."

bar charts by vertical

source = ColumnDataSource(verticals)

p = Bar(data, values=‘vertical’, label=‘vertical’, agg=‘count’,

fill_alpha=0.3, outline_line_alpha=0, line_color=‘white’, notebook=True, tools=False,

color=‘grey’)

p.legend.location = None

p.title.text = ‘Most attempts come from X vertical’

labels = LabelSet(x=‘vertical’, y=‘count’, text=‘count’, level=‘glyph’,

x_offset=5, y_offset=5, source=source, render_mode=‘canvas’, text_font_size=“8pt”)

p.axis.minor_tick_in = 0

p.axis.minor_tick_out = 0

p.axis.major_tick_in = 0

p.axis.major_tick_out = 0

p.xgrid.grid_line_color = None

p.ygrid.grid_line_color = None

p.add_layout(labels)

show(p)

⌁   Link to post
Bryan
Bryan

The potential for out of order cell execution, and having to combine two large projects with multiple language runtimes makes jupyter integration extremely challenging. If you can isolate a reproducible set of steps to cause the problem, please submit a big report on GitHub. Otherwise, it’s probably a fairly rare fluke (I’ve not encountered that message in a notebook before)

Thanks,

Bryan

···

On Apr 4, 2017, at 17:04, Kasia Rachuta korachuta@gmail.com wrote:

Update: It renders when I restart the Jupyter notebook. It literally just shows up. I have no idea why.

On Tuesday, 4 April 2017 14:52:42 UTC-7, Kasia Rachuta wrote:

I’m trying to create a bar chart with labels above the bars (something like the screenshot attached). Now I’m re-using the code with a different data frame (data, although labels come from a different one that’s already aggregated) Underneath is my code which gives me the following error: "Javascript error adding output!
Error: Error rendering Bokeh model: could not find tag with id: 8c51aaa0-128b-4f6c-814f-b44d021a83cd

See your browser Javascript console for more details."

bar charts by vertical

source = ColumnDataSource(verticals)

p = Bar(data, values=‘vertical’, label=‘vertical’, agg=‘count’,

fill_alpha=0.3, outline_line_alpha=0, line_color=‘white’, notebook=True, tools=False,

color=‘grey’)

p.legend.location = None

p.title.text = ‘Most attempts come from X vertical’

labels = LabelSet(x=‘vertical’, y=‘count’, text=‘count’, level=‘glyph’,

x_offset=5, y_offset=5, source=source, render_mode=‘canvas’, text_font_size=“8pt”)

p.axis.minor_tick_in = 0

p.axis.minor_tick_out = 0

p.axis.major_tick_in = 0

p.axis.major_tick_out = 0

p.xgrid.grid_line_color = None

p.ygrid.grid_line_color = None

p.add_layout(labels)

show(p)

–

You received this message because you are subscribed to the Google Groups “Bokeh Discussion - Public” group.

To unsubscribe from this group and stop receiving emails from it, send an email to bokeh+unsubscribe@continuum.io.

To post to this group, send email to bokeh@continuum.io.

To view this discussion on the web visit https://groups.google.com/a/continuum.io/d/msgid/bokeh/3bcda35c-c156-460d-9d73-df71a195fdcd%40continuum.io.

For more options, visit https://groups.google.com/a/continuum.io/d/optout.

⌁   Link to post
nealmcb
nealmcb

I had the same problem. For problems that are so hard to reproduce, documenting workarounds is very helpful.

For me, it was enough to just rerun the “output_notebook()” function.

Neal McBurnett http://neal.mcburnett.org/

···

On Tuesday, April 4, 2017 at 4:04:04 PM UTC-6, Kasia Rachuta wrote:

Update: It renders when I restart the Jupyter notebook. It literally just shows up. I have no idea why.

On Tuesday, 4 April 2017 14:52:42 UTC-7, Kasia Rachuta wrote:

I’m trying to create a bar chart with labels above the bars (something like the screenshot attached). Now I’m re-using the code with a different data frame (data, although labels come from a different one that’s already aggregated) Underneath is my code which gives me the following error: "Javascript error adding output!
Error: Error rendering Bokeh model: could not find tag with id: 8c51aaa0-128b-4f6c-814f-b44d021a83cd

See your browser Javascript console for more details."

bar charts by vertical

source = ColumnDataSource(verticals)

p = Bar(data, values=‘vertical’, label=‘vertical’, agg=‘count’,

fill_alpha=0.3, outline_line_alpha=0, line_color=‘white’, notebook=True, tools=False,

color=‘grey’)

p.legend.location = None

p.title.text = ‘Most attempts come from X vertical’

labels = LabelSet(x=‘vertical’, y=‘count’, text=‘count’, level=‘glyph’,

x_offset=5, y_offset=5, source=source, render_mode=‘canvas’, text_font_size=“8pt”)

p.axis.minor_tick_in = 0

p.axis.minor_tick_out = 0

p.axis.major_tick_in = 0

p.axis.major_tick_out = 0

p.xgrid.grid_line_color = None

p.ygrid.grid_line_color = None

p.add_layout(labels)

show(p)

⌁   Link to post
darahsten
darahsten

This has happened to me several times. Every time it happened because I forgot to add the safe filter to the div (Using bokeh with django).
in view

plot_script, plot_div = components(plot)

in template

{{plot_script |safe}}

{{ plot_div }}

django renders the plot_div not as text rather than as html something along the lines of

Instead of the proper html which would render properly in the template.

To solve this just {{ plot_div | safe }}

···

On Tuesday, 4 April 2017 23:52:42 UTC+2, Kasia Rachuta wrote:

I’m trying to create a bar chart with labels above the bars (something like the screenshot attached). Now I’m re-using the code with a different data frame (data, although labels come from a different one that’s already aggregated) Underneath is my code which gives me the following error: "Javascript error adding output!
Error: Error rendering Bokeh model: could not find tag with id: 8c51aaa0-128b-4f6c-814f-b44d021a83cd

See your browser Javascript console for more details."

bar charts by vertical

source = ColumnDataSource(verticals)

p = Bar(data, values=‘vertical’, label=‘vertical’, agg=‘count’,

fill_alpha=0.3, outline_line_alpha=0, line_color=‘white’, notebook=True, tools=False,

color=‘grey’)

p.legend.location = None

p.title.text = ‘Most attempts come from X vertical’

labels = LabelSet(x=‘vertical’, y=‘count’, text=‘count’, level=‘glyph’,

x_offset=5, y_offset=5, source=source, render_mode=‘canvas’, text_font_size=“8pt”)

p.axis.minor_tick_in = 0

p.axis.minor_tick_out = 0

p.axis.major_tick_in = 0

p.axis.major_tick_out = 0

p.xgrid.grid_line_color = None

p.ygrid.grid_line_color = None

p.add_layout(labels)

show(p)

⌁   Link to post

End of archived discussion · Replies are disabled