Hi,
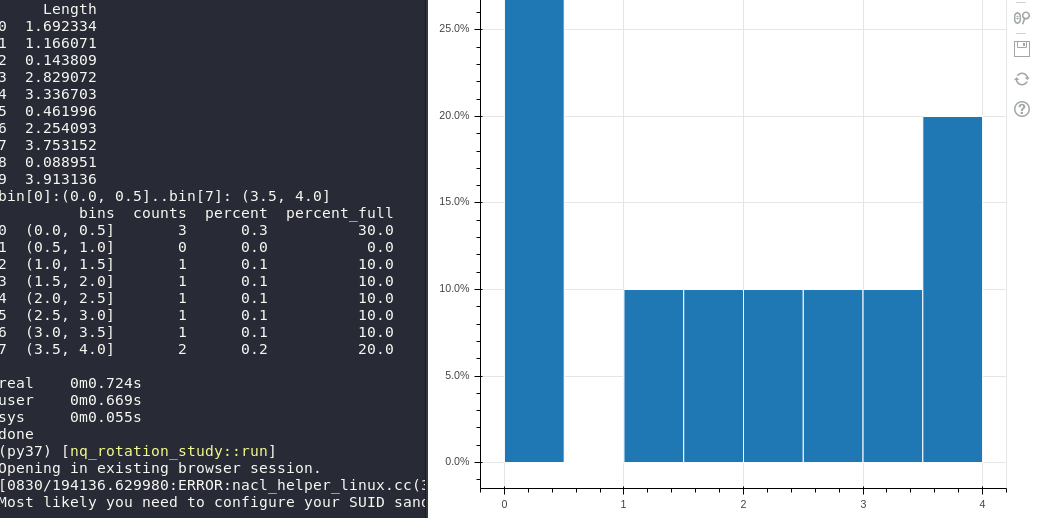
Is it possible to have custom labels with the quad() method? So instead of 0,1,2,3,4,5 is it possible to have things like bins? For example (0,0.5], (0.5,1], (1,1.5]
Hi,
Is it possible to have custom labels with the quad() method? So instead of 0,1,2,3,4,5 is it possible to have things like bins? For example (0,0.5], (0.5,1], (1,1.5]
It doesn’t matter what glyphs you use - quad, lines, dots, whatever. It all depends on the axes and their tick formatters: Styling visual attributes — Bokeh 2.4.2 Documentation
This example may be helpful:
bokeh/custom_datetime_axis.py at main · bokeh/bokeh · GitHub
You would want to compute the “center” of each bin and configure the axis ticker with that list to set fixed tick locations. Then use major_label_overrides to explicitly provide your own labels for those fixed locations.
That said, there might be issues with floating point representation that cause issues for major_label_overrides to function (FP numbers as keys of a dict is always dicey). In that case a CustomJSTickFormatter is probably the only other option.
All that said, I think personally a better solution is to pass the bin edge coordinates as the fixed tick locations, and not use any custom tick formatting at all (just regular axis numbers). That would show the same information (i.e labelling the bin extents). It’s very unusual to label individual bars of a histogram with “categorical”-like labels (and also just more work to accomplish)
Sure. Thanks. I’m exploring both approaches right now. Is there a way to force the x-axis to display every value in the range?
Right now it approximates and skips some of the values.
I’m exploring both approaches right now. Is there a way to force the x-axis to display every value in the range?
Yes, as I already mentioned you can create fixed tick locations with whatever tick locations you want:
configure the axis
tickerwith that list to set fixed tick locations.
also in the docs: