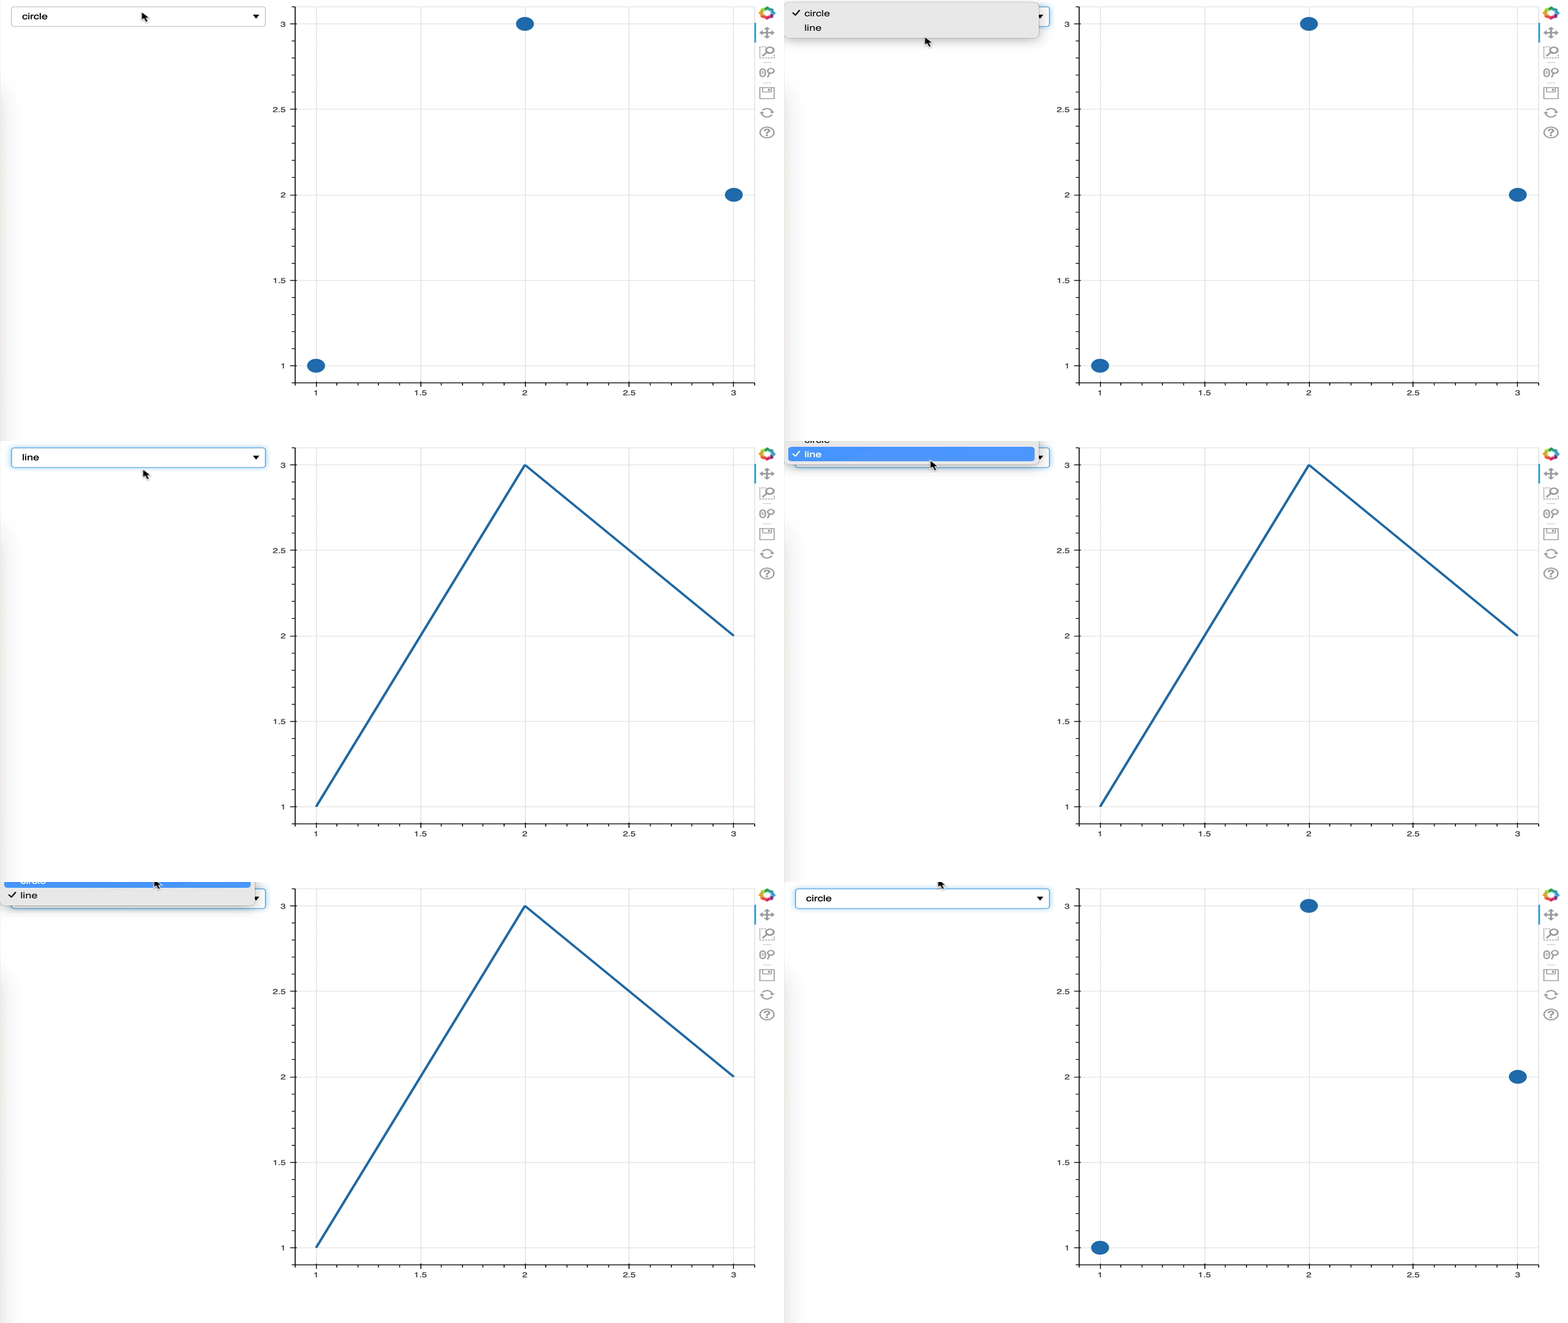
@Vishal_Agarwal This is what I meant:
from bokeh.layouts import row, column
from bokeh.models import CustomJS, Select
from bokeh.plotting import figure, show

p1 = figure()
p1.circle([1,2,3], [1,3,2], size=20)

p2 = figure(visible=False)
p2.line([1,2,3], [1,3,2], line_width=3)

col = column(p1, p2)

s = Select(value="circle", options=["circle", "line"])

s.js_on_change('value', CustomJS(args=dict(s=s, col=col), code="""
    for (const plot of col.children) {
        plot.visible = false
    }

    // Pick one of the column children to make visible.
    //
    // *You* will have to provide the logic to decide which one of the
    // children to make visible, based on the select value. That is a
    // policy decision that depends completely on your requirements.
    if (s.value == "circle") {
        col.children[0].visible = true
    }
    else if (s.value == "line") {
        col.children[1].visible = true
    }
"""))

show(row(s, col))
This uses single plots for simplicity, but replace them with any more complicated layout and it is the same.
