I can’t get the legend to appear as the top layer. It looks like it’s getting hidden behind whatever comprises the frame:
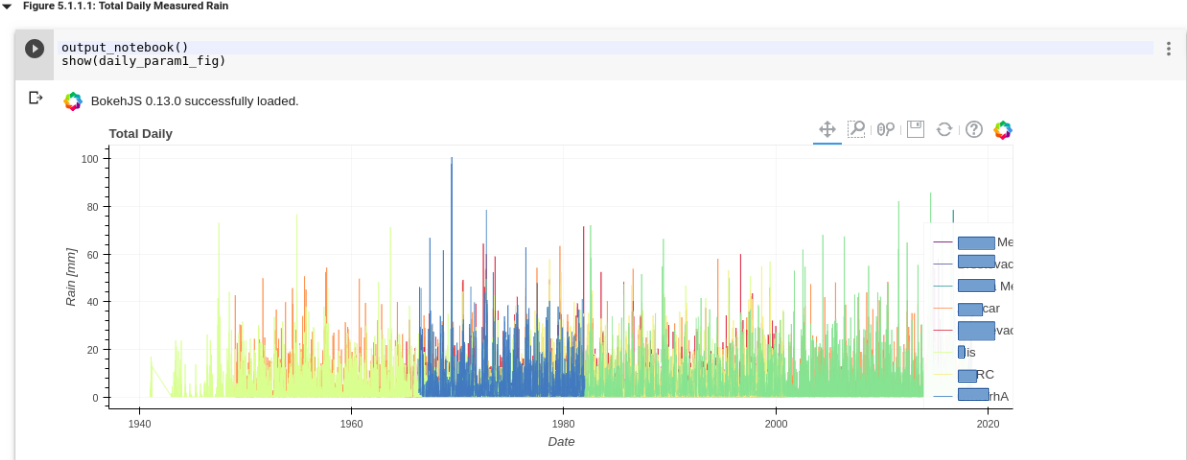
I put the blue squares to partially hide the series names because they are identifying information.
Minimal example below.
all_daily_data = pd.DataFrame()
all_daily_data[‘Date’] = pd.to_datetime([‘2018-01-01’, ‘2018-01-02’, ‘2018-01-03’, ‘2018-01-04’, ‘2018-01-05’])
all_daily_data[‘temp’] = [0.1, 0.13, 0.14, 2.5, 1.4]
source for figure
daily_source = ColumnDataSource(all_daily_data)
create the figure
daily_fig = figure(x_axis_type=“datetime”, title=“Avg. Daily”,
width=1000, height=350, toolbar_location=“above”)
daily_legend =
s1 = daily_fig.line(‘Date’, ‘temp’,
source=daily_source,
color=‘red’,
alpha=0.7)
daily_legend.append((’ Measured’, [s1]))
set the ability to toggle series by clicking on the legend item
legend_items = [(daily_fig, daily_legend)]:
legend = Legend(items=legend_items,
location=(900,-30),
click_policy=‘hide’)
fig.add_layout(legend)
for jupyter notebooks and google colab, you need output_notebook() in the code frame you want the figure displayed.
output_notebook()
show(daily_fig)