Hi,
Each plot has a p.legend property that returns a list of all its legends. There is often only one legend, so p.legend[0] will get you that single legend. Legend objects in turn, have a .items property. It is just a list of “legend items” to render.
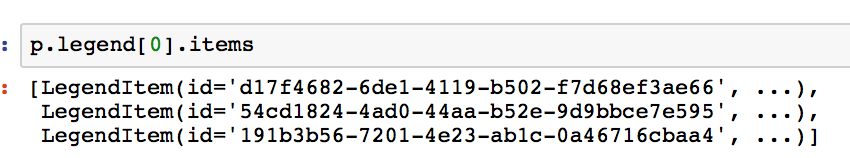
Their order in this list is the order they appear visually in the legend.
You can re-order this .items list to be in whatever order you like, although you may have to inspect each item a bit to determine which group it is for, etc.
Thanks,
Bryan
···
On May 26, 2017, at 01:26, Nitin Solanki [email protected] wrote:
Hi,
I’d like to order the legends in my own way. I’m plotting a stacked bar chart and legends are shown according to ‘y’ column in same order they are plotting. I want to show legend in my order…
Below is the code of stacked bar chart that is using their way to do legend displaying.
plot = Bar(df, values=‘same_number’, label=CatAttr(columns=[‘x’], sort=False),
title="Stacked chart ", stack=‘y’, legend=‘top_left’,
plot_width=700, plot_height=300, color=color( columns=‘colors’, palette=palettes, sort=False))Thanks.
This e-mail, including any attached files, may contain confidential and privileged information for the sole use of the intended recipient. Any review, use, distribution, or disclosure by others is strictly prohibited. If you are not the intended recipient (or authorized to receive information for the intended recipient), please contact the sender by reply e-mail and delete all copies of this message.
–
You received this message because you are subscribed to the Google Groups “Bokeh Discussion - Public” group.
To unsubscribe from this group and stop receiving emails from it, send an email to [email protected].
To post to this group, send email to [email protected].
To view this discussion on the web visit https://groups.google.com/a/continuum.io/d/msgid/bokeh/CAOUEs4UkO_rpKXKj5n6ANR8uiKMdfPEqYO57hdiby638u%2BfUoQ%40mail.gmail.com.
For more options, visit https://groups.google.com/a/continuum.io/d/optout.