There are a lot of ways to do this and the best approach will depend on your needs:
- Do you have multiple glyph types or is it always “circle”/Scatter?
- Do you have the same labels/color map for each one?
- Do you need interactivity in the legend?
One way that would cover you minus the interactivity:
Let bokeh do the legend building, but then just retrieve the legend model and then “move it” with add_layout:
from bokeh.models import Scatter, ColumnDataSource
from bokeh.plotting import figure,show

import numpy as np

f = figure()

#make a bunch of random stuff, adding to the legend as we go

for i in range(5):
    src= ColumnDataSource(data={'x':np.random.random(3),'y':np.random.random(3),'lbl':['A','B','C'],'c':['red','blue','green']})
    r = f.scatter(x='x',y='y',legend_group='lbl',fill_color='c',source=src,size=10)

leg = f.legend[0]
f.add_layout(leg,'below')
show(f)
Now you’ll see that this gets you 90% of the way there:
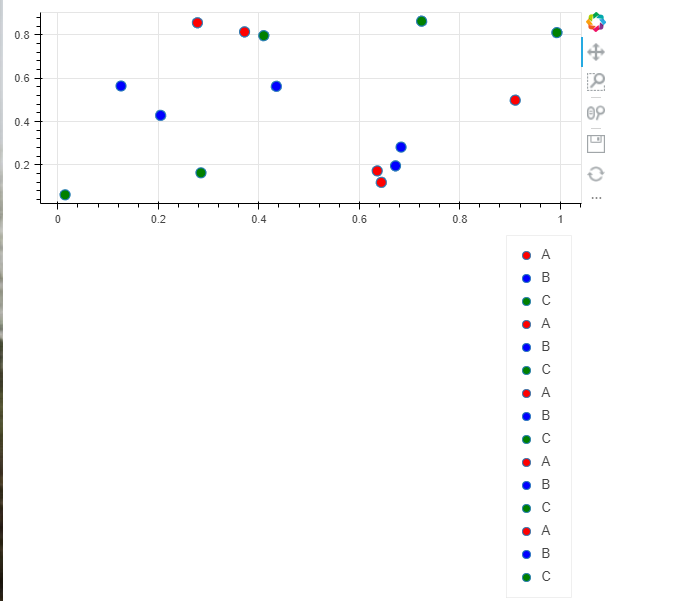
But you’ll probably be wanting to remove “duplicate” things from the legend… In my example it’s pretty glaring because all 5 renderers are A,B, and C… but you might have one renderer with a “D” in it/different colors or even glyphs etc. that need their own unique legend item.
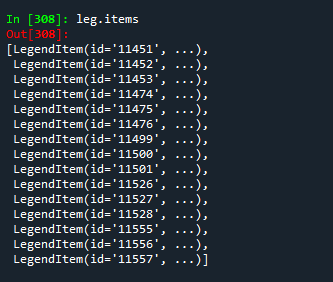
To remove the redundancy, you can inspect the legend for all the items it has:
and you look at one of these items’ properties:
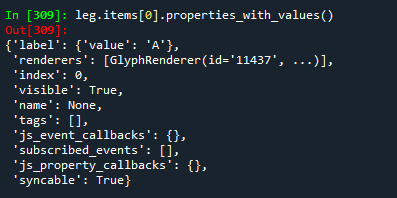
you can kinda get the idea of collecting unique labels:
item_list = []
lbl_list = []
for item in leg.items:
    if item.label['value'] not in lbl_list:
        lbl_list.append(item.label['value'])
        item_list.append(item)
then reassign the legend.items with that cleaned up list:
leg.items = item_list
Now the caveat to this, is that it will break if you have duplicate labels with different glyphs (e.g. if ‘A’ has a scatter and a line)… now to work around that I’d probably break up my legend building glyph by glyph:
#scatter glyphs
for i in range(5):
    src= ColumnDataSource(data={'x':np.random.random(3),'y':np.random.random(3),'lbl':['A','B','C'],'c':['red','blue','green']})
    r = f.scatter(x='x',y='y',legend_group='lbl',fill_color='c',source=src,size=10)

#line glyphs
for i in range(5):
    src= ColumnDataSource(data={'x':np.random.random(3),'y':np.random.random(3),'lbl':['A','B','C'],'c':['red','blue','green']})
    r = f.line(.....)
Then it should be pretty straightforward to do the label trimming operation on each of these and then put them together at the end.
Overall everything is there for you to access and customize to suit your needs, you just gotta go digging a bit to get it and rearrange/organize.