Question:
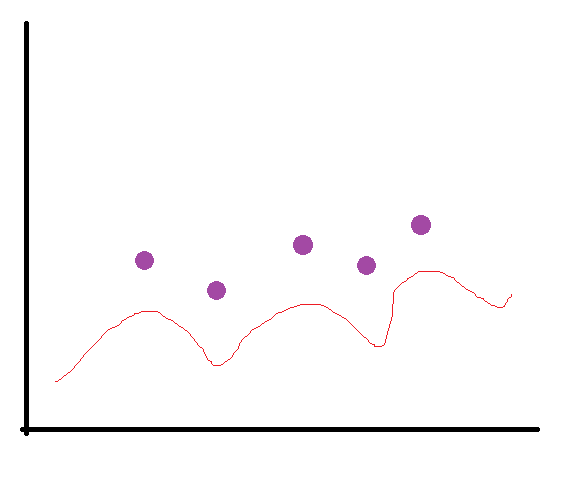
Is it possible to use scatter and line plots on the same graph?
Currently we are using glyphs, but after about 200 glyphs, it really starts to slow down the loading process.
I realized we could replace the glyphs with scatter points, but I have not been able to find any documentation about this.
Thanks!