Line is not displayed when type of `dates` is `list[datetime.date]`, but line is displayed when type of `dates` is `numpy.ndarray[datetime.date]`. What's the difference?

What would I like to do?

I would like to create line chart with date axes.

dates = [datetime.datetime(2022, 8, 1), datetime.datetime(2022, 8, 2)]
sales = [100, 200]
plot = figure(x_axis_type="datetime")
plot.line(x=dates, y=sales)
show(plot)

What happend?

When type of dates is list[datetime.date], line is not displayed.

dates = [datetime.date(2022, 8, 1), datetime.date(2022, 8, 2)]
sales = [100, 200]
plot = figure(x_axis_type="datetime")
plot.line(x=dates, y=sales)
show(plot)

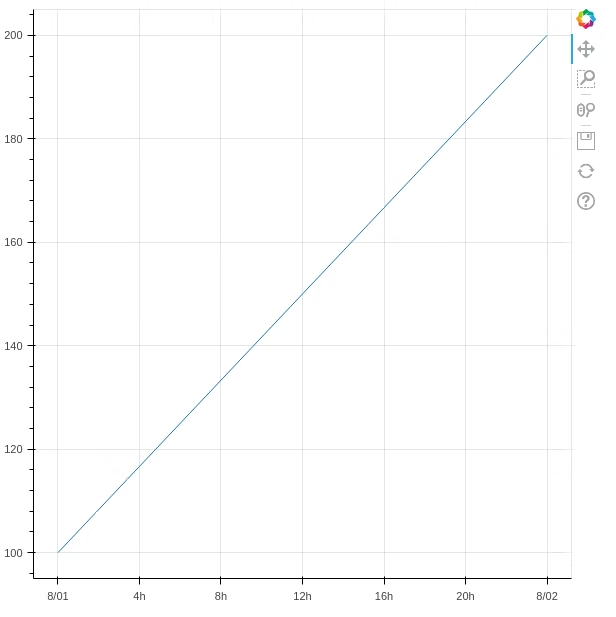
But when type of dates is numpy.ndarray[datetime.date], line is displayed.

Question

I can understand that type of dates must be list[datetime.datetime] not list[datetime.date].
But I cannot understand that type of dates must be numpy.ndarray[datetime.date] not list[datetime.date].

Why is line displayed when type of dates is numpy.ndarray[datetime.date]?

Environmental

  • Python3.10.2
  • bokeh 2.4.3

Supplementary

I wrote the phenomenon in Japanese.

I can imagine a few interpretations of this. You need to to provide the actual code that creates the array that works. Most likely, numpy has done its own conversion to a datetime dtype, but without code, that is just speculation.

You need to to provide the actual code that creates the array that works.

Sorry. I forgot to providing the code.

import numpy
import datetime
from bokeh.plotting import figure, show
dates = numpy.array([datetime.date(2022, 8, 1), datetime.date(2022, 8, 2)])
sales = [100, 200]
plot = figure(x_axis_type="datetime")
plot.line(x=dates, y=sales)
show(plot)

  • numpy v1.22.3

Hi @yuji38kwmt I should have specified more explicitly: please provide a complete code, i.e. a Minimal Reproducible Example that can copy and pasted and run immediately with no modifications. The code above is missing imports, at least.

Sorry.

I added import statement to the above code.

I want to edit the topic in order to adding import statements.
But I did not found “edit” button. How can I edit the topic?

It is the little pencil icon below the post:

Screen Shot 2022-08-22 at 08.31.55

Thanks!

But there is not pencil icon below the first post.
In secondary post, there is pencil icon.

Don’t I hove permission to edit the first post?


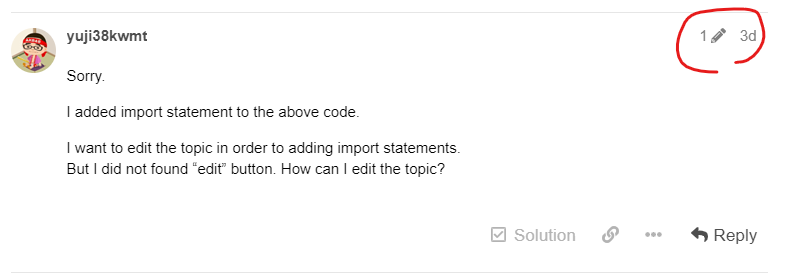
@yuji38kwmt I am not sure why it is not showing for you. Your account is at Trust-Level 1 so as far as I know, you should be able to edit your own posts. At this point, probably simplest to include the MRE in a reply.

I wrote a Minimal Repdorucible Example.

Case that can create line chart with data axes

import datetime
from bokeh.plotting import figure, show
dates = [datetime.datetime(2022, 8, 1), datetime.datetime(2022, 8, 2)]
sales = [100, 200]
plot = figure(x_axis_type="datetime")
plot.line(x=dates, y=sales)
show(plot)

Case that can NOT create line chart with data axes

import datetime
from bokeh.plotting import figure, show
dates = [datetime.date(2022, 8, 1), datetime.date(2022, 8, 2)]
sales = [100, 200]
plot = figure(x_axis_type="datetime")
plot.line(x=dates, y=sales)
show(plot)

Case that can create line chart with data axes when type of dates is numpy.ndarray[datetime.date]

import numpy
import datetime
from bokeh.plotting import figure, show
dates = numpy.array([datetime.date(2022, 8, 1), datetime.date(2022, 8, 2)])
sales = [100, 200]
plot = figure(x_axis_type="datetime")
plot.line(x=dates, y=sales)
show(plot)

At this point, probably simplest to include the MRE in a reply.

OK! I wrote MRE in a reply.

Ah, I had a look at the serialization code, and recalled why this is. We serialize date objects as ISO date strings in order that things like date-pickers can function correctly. Date objects are not going to work in this situation, you will need to convert to datetimes or timestamps.

1 Like

This topic was automatically closed 90 days after the last reply. New replies are no longer allowed.