What would I like to do?
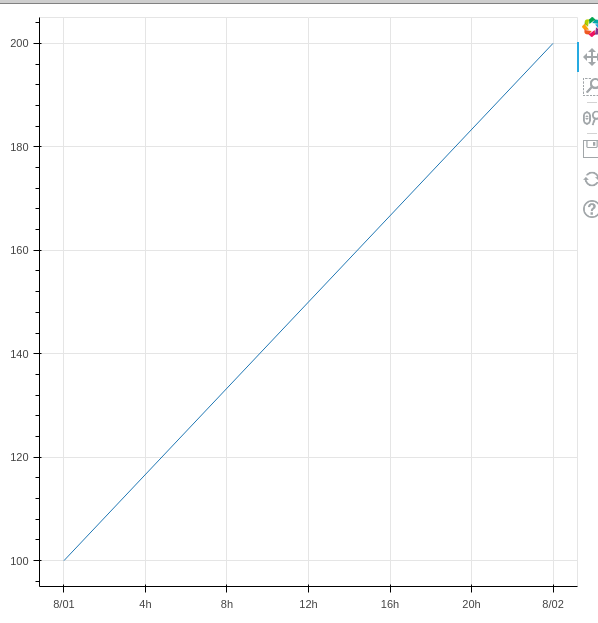
I would like to create line chart with date axes.
dates = [datetime.datetime(2022, 8, 1), datetime.datetime(2022, 8, 2)]
sales = [100, 200]
plot = figure(x_axis_type="datetime")
plot.line(x=dates, y=sales)
show(plot)
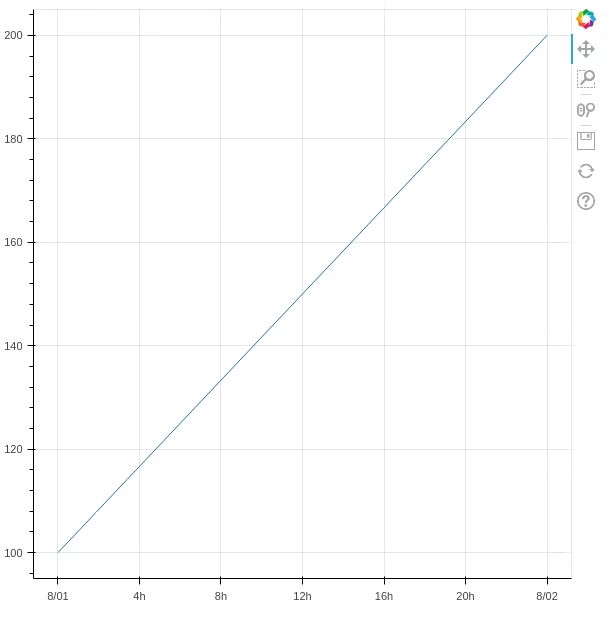
What happend?
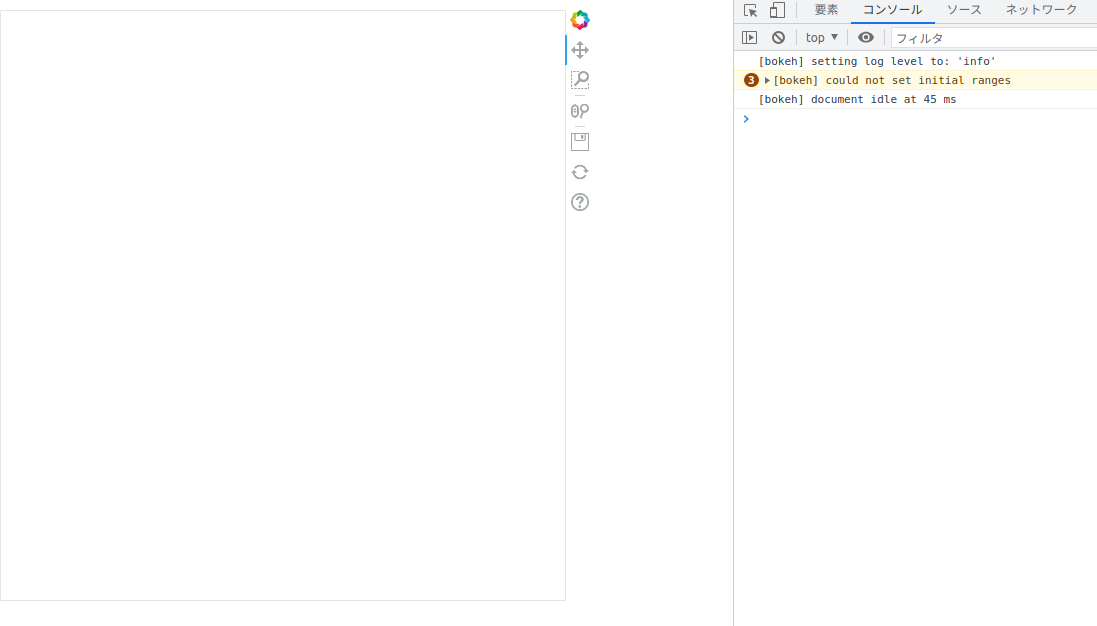
When type of dates is list[datetime.date], line is not displayed.
dates = [datetime.date(2022, 8, 1), datetime.date(2022, 8, 2)]
sales = [100, 200]
plot = figure(x_axis_type="datetime")
plot.line(x=dates, y=sales)
show(plot)
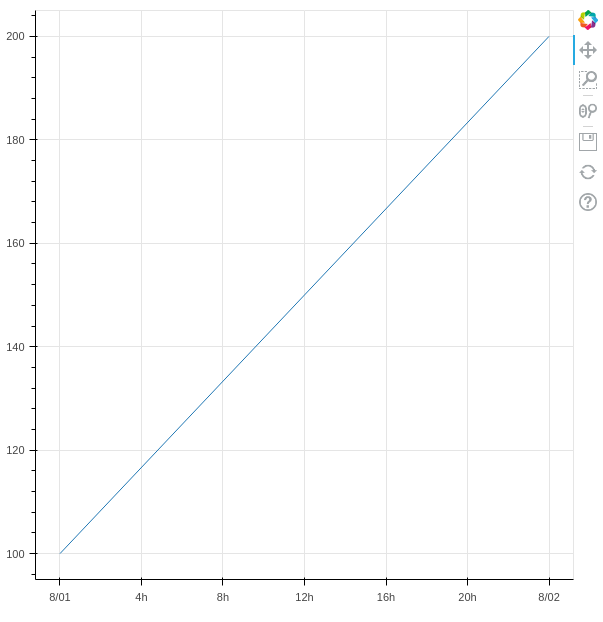
But when type of dates is numpy.ndarray[datetime.date], line is displayed.
Question
I can understand that type of dates must be list[datetime.datetime] not list[datetime.date].
But I cannot understand that type of dates must be numpy.ndarray[datetime.date] not list[datetime.date].
Why is line displayed when type of dates is numpy.ndarray[datetime.date]?
Environmental
- Python3.10.2
- bokeh 2.4.3
Supplementary
I wrote the phenomenon in Japanese.