Hi Bokeh Community,
I am a new user of bokeh! I am trying to use CheckboxGroup and found an issue in one of scripts.
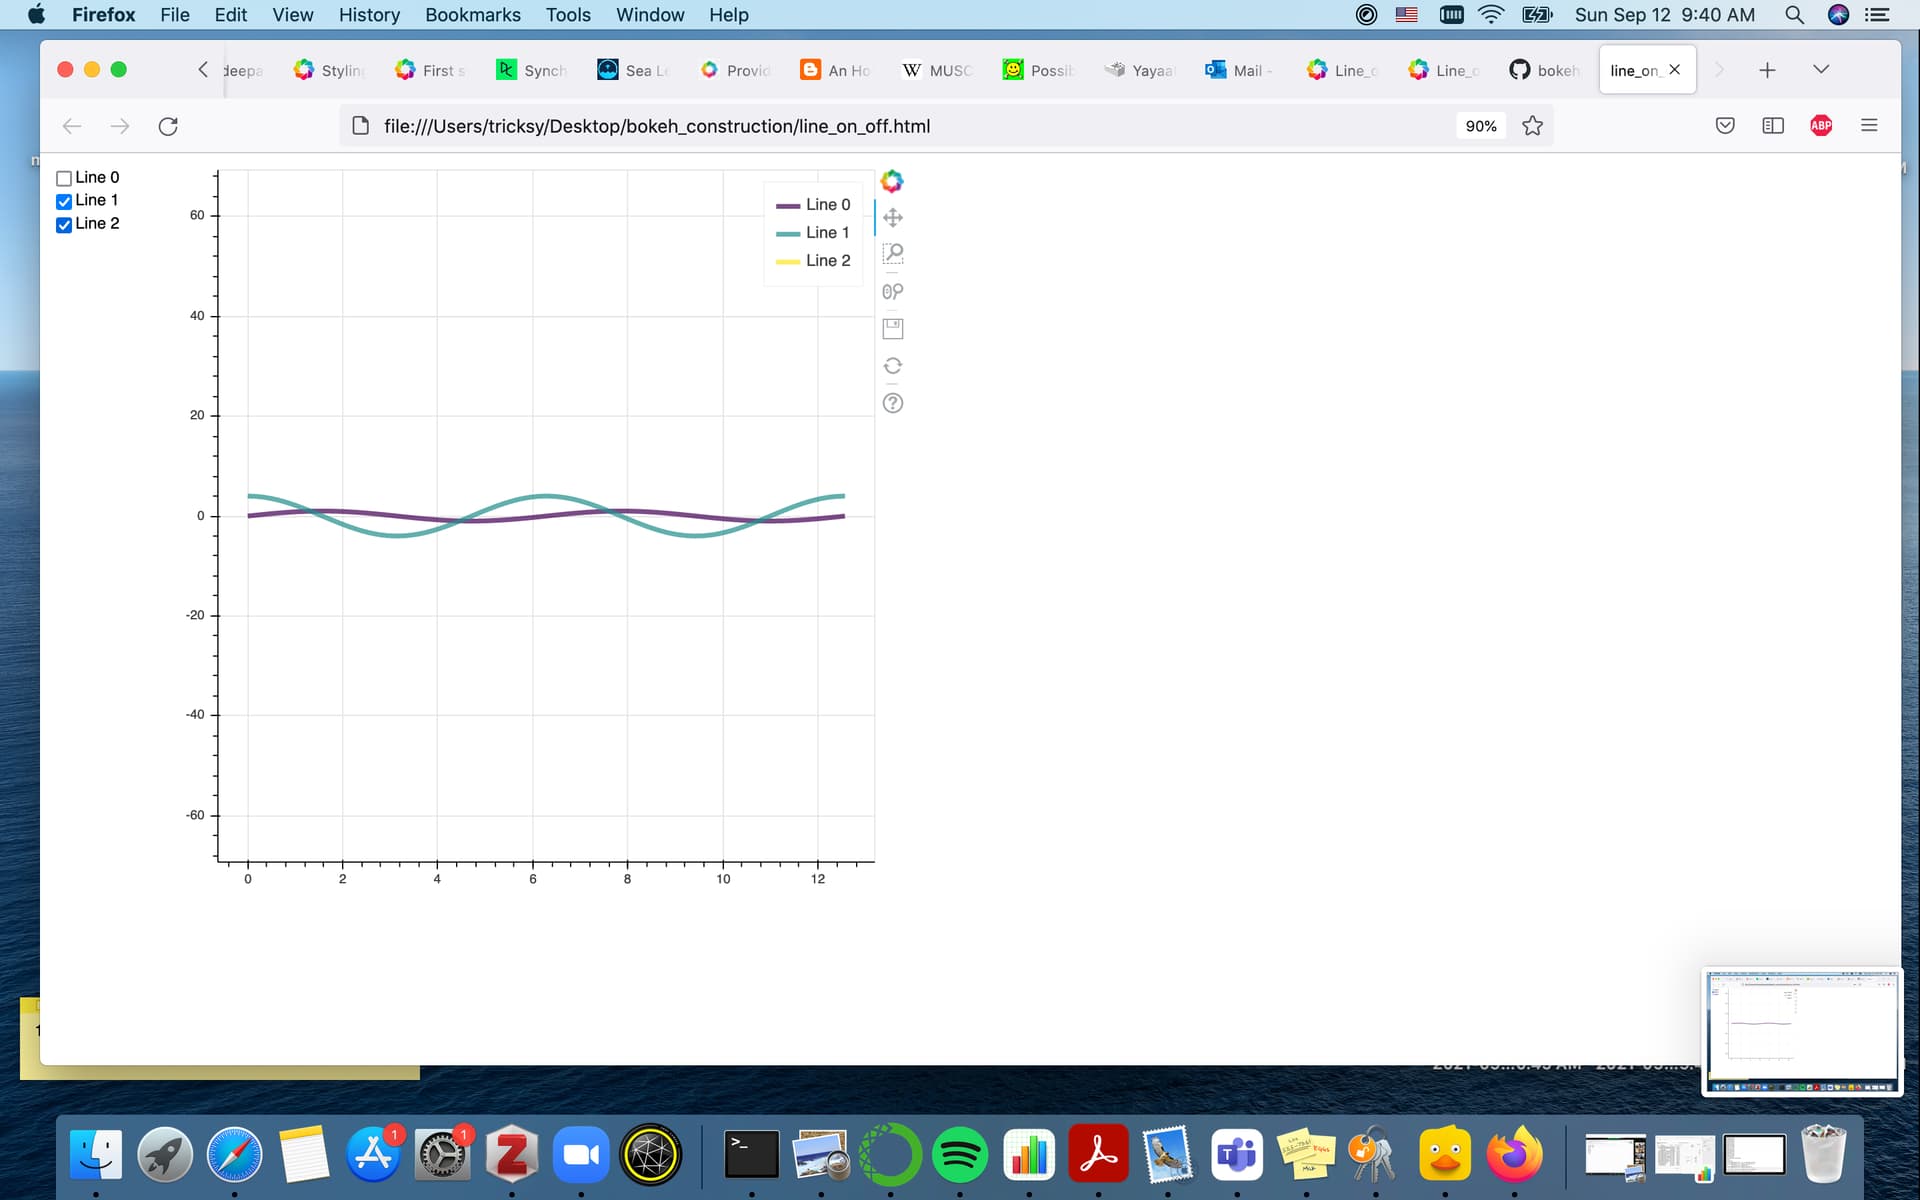
Before complaining though, I wanted to say thank you for making this! I did find it helpful for learning to implement CheckboxGroup. However, I noticed that if you uncheck all the boxes that regardless of which box is selected, the updated plot displays only in order of basically line 0, line 1, line 2. For example, if one unchecks all the boxes and clicks “Line 2” in the rendered checkbox, the data for Line 0 will display; the data for Line 0 will display first regardless of clicks. Does that make sense? How can I get the clicking of a specific checkbox to correspond with the correct data??
My default browser if Firefox 91.0.2 (64 bit) and the version of bokeh I am using is 1.4.0. Probably worth also noting that I don’t know JS… Really hope to hear from someone soon!
@salbal I can’t reproduce what you describe, with either bokeh 1.4 (which BTW is fairly old at this point, you really ought to upgrade if you are at all able to) or with latest branch-2.4. If I uncheck all the boxes and then re-check individual ones, the appropriate and expected line always becomes visible. At this point I’d suggest posting a short screen capture video to show exactly what you are seeing, so that there is no chance of misunderstanding. Additionally some lines from the bokeh server console log and the browser JS console log would be beneficial.
From the screenshots we can see that boxes “Line 1” and “Line 2” are selected, but displayed is Line 0 and Line 1… Line 0 is always the first line displayed despite which actual box is ticked on my end anyways.
I tried launching from jupyter notebook but I couldn’t get it to work and was given this error:
WARNING:bokeh.embed.util:
You are generating standalone HTML/JS output, but trying to use real Python
callbacks (i.e. with on_change or on_event). This combination cannot work.
Only JavaScript callbacks may be used with standalone output. For more
information on JavaScript callbacks with Bokeh, see:
Alternatively, to use real Python callbacks, a Bokeh server application may
be used. For more information on building and running Bokeh applications, see:
@salbal This code is for a Bokeh server application. The BokehServer is the Python process that executes any Python callbacks in the code. For this code to function properly you have to run it as a Bokeh server application:
bokeh serve --show line_on_off.py
If you don’t want to run a Bokeh server, then the only option is to use JavaScript CustomJS callbacks (because in that case there is no Python process to run Python callbacks, just a browser showing HTML, and browsers can only execute JavaScript, they do not know or understand Python code). There is a similar standalone (i.e. non-Bokeh server) version of this example that uses JS callbacks here:
That said, if you just want simple way to toggle glyphs on and off, Bokeh supports interactive legends out of the box, no need for any callbacks at all.
Ok! Perfect, problem solved! Thanks so much for your help @Bryan !!
The resolution was exactly as you said-- running it through bokeh serve. The way I did this, as my terminal would not pick up plain bokeh commands, was:
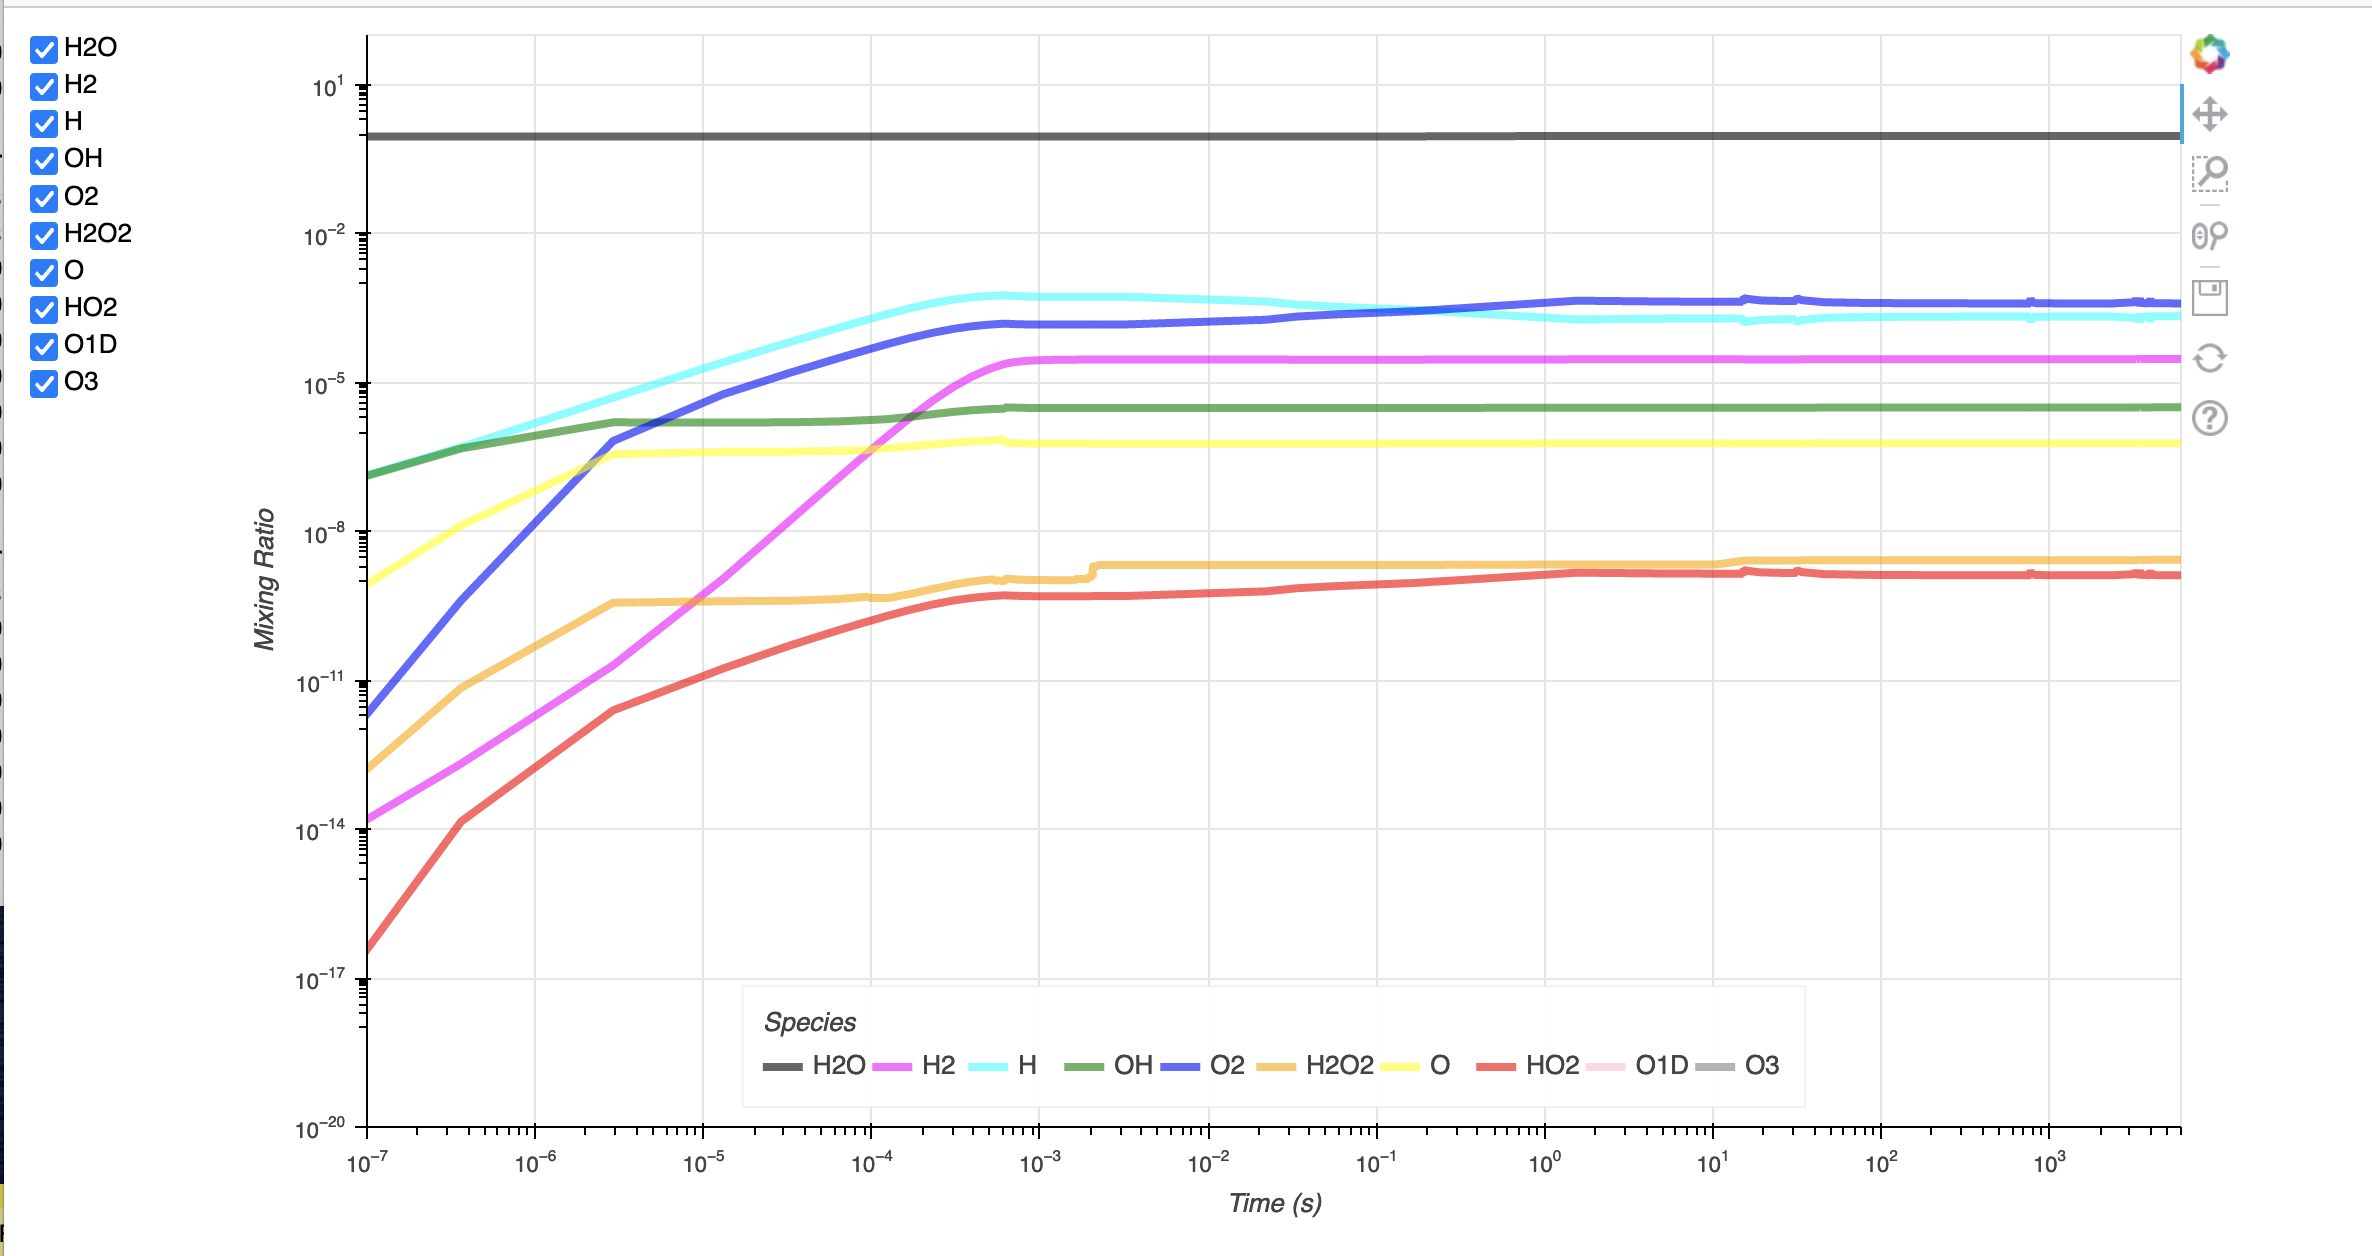
As for this, this looks great, however, can you explain the Note on this page? I think I might fall into the ‘loophole’ of this note-- in my screenshot, I generate each curve by a separate line of code