

☰Read-only archive⌕
Looking for help with Bokeh?

This is a read-only archive. Ask questions and join the conversation on GitHub.

Visit Community Support on GitHub →
Archived discussions · Captured October 28, 2026

Linear_cmap applied to patches

Community Support
Alex_Kolby
Alex_Kolby

Hello,

I am trying to use a linear color mapper as fill color in a patches object. So far i have got to the conclusion that the values which the color is being mapped to is evaluated as NaN since the drawing turns all red using the minimal reproducible example below.

from bokeh.plotting import figure, show
from bokeh.transform import linear_cmap
from colorcet import coolwarm

x = [[1, 2, 3, 4]]
y = [[2, 3, 2, 4]]

p = figure(width=400, height=400)
color = linear_cmap('y', palette=coolwarm, low=1, high=3,nan_color='red')
source = {'x': x, 'y': y}
p.patches('x', 'y', source=source,fill_color = color)

show(p)
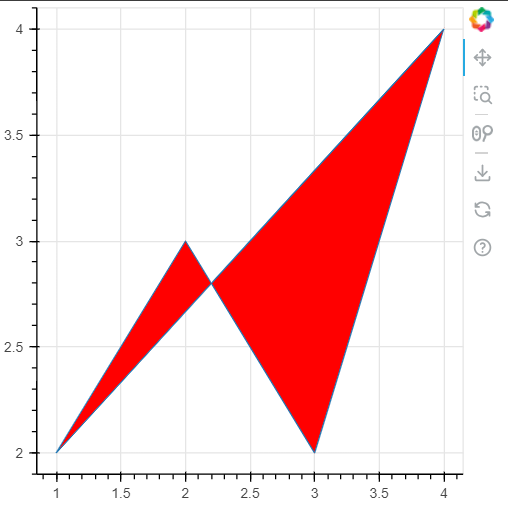
I guess this has something to do with the ‘y’ column in source containing list of lists? Am i doing something wrong or is there a workaround?

⌁   Link to post
Jonas_Grave_Kristens

@Alex_Kolby Yes, Alex it has to do with the use of patches where the x, y data is a list of lists. In your example, you have defined 1 patch.
The syntax is:

xs = [[x data patch 0], [x data patch 1], ... ]
ys = [[y data patch 0], [y data patch 1], ... ]

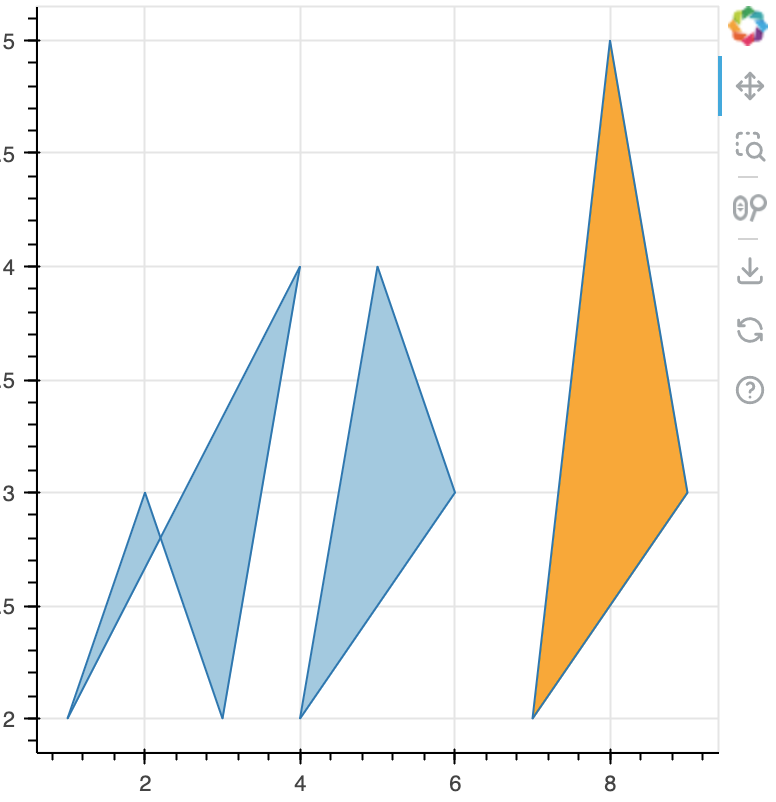
So you would need to add a field to your source that got values to map against. Eg for 2 patches:

x = [[4, 5, 6], [7, 8, 9]] # list of 2 lists (patches)
y = [[2, 4, 3], [2, 5, 3]]
value = [2, 5]              # 2 values

See the example below

from bokeh.plotting import figure, show
from bokeh.transform import linear_cmap
from bokeh.palettes import Blues8

x = [[1, 2, 3, 4]]
y = [[2, 3, 2, 4]]
value = [2]

p = figure(width=400, height=400)
color = linear_cmap('value', palette=Blues8, low=1, high=3,nan_color='red')
source = {'x': x, 'y': y, 'value': value}
p.patches('x', 'y', source=source,fill_color = color)

x2 = [[4, 5, 6], [7, 8, 9]]
y2 = [[2, 4, 3], [2, 5, 3]]
value2 = [2, 5]

color2 = linear_cmap(
	'value', palette=Blues8,
	low=1, high=3,
	nan_color='red', 
	high_color = 'orange'
	)
source2 = {'x': x2, 'y': y2, 'value': value2}
p.patches('x', 'y', source=source2,fill_color = color2)

show(p)
⌁   Link to post

End of archived discussion · Replies are disabled
