

I would like to discover how to link a plot and a map as I can do it with dc.js Try the example http://webportals.ipsl.jussieu.fr/ScientificApps/dev/forge_patrick/dc/dc1.html where you have also displayed clusters.
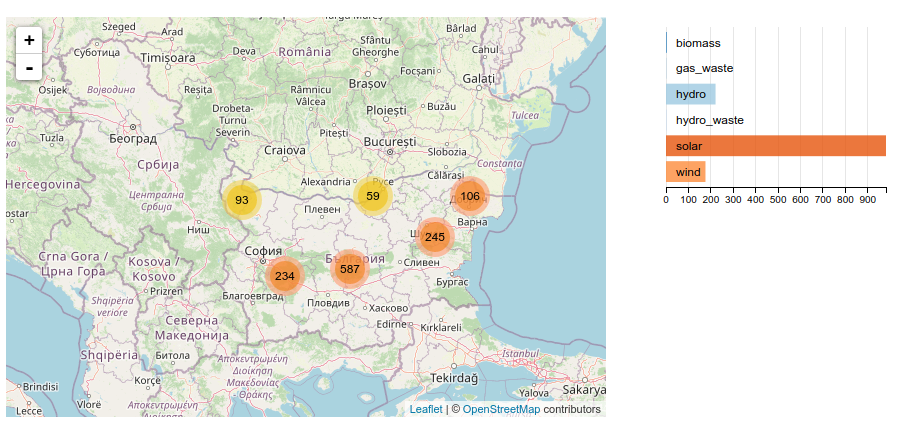
As you can see, there is a linked behaviour between the map boundaries and the chart.
I have started coding with bokeh from a jupyter notebook but haven’t found way to set interlinks:
display categories when map moves, display on the map selected categories.
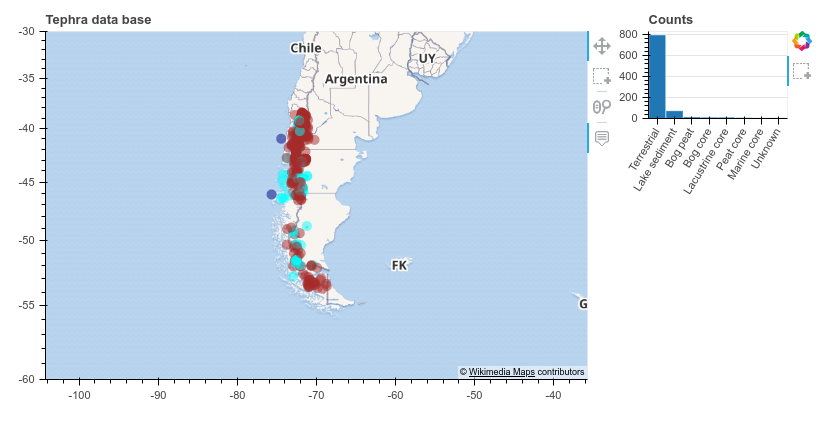
Any example to share ?
Regards


