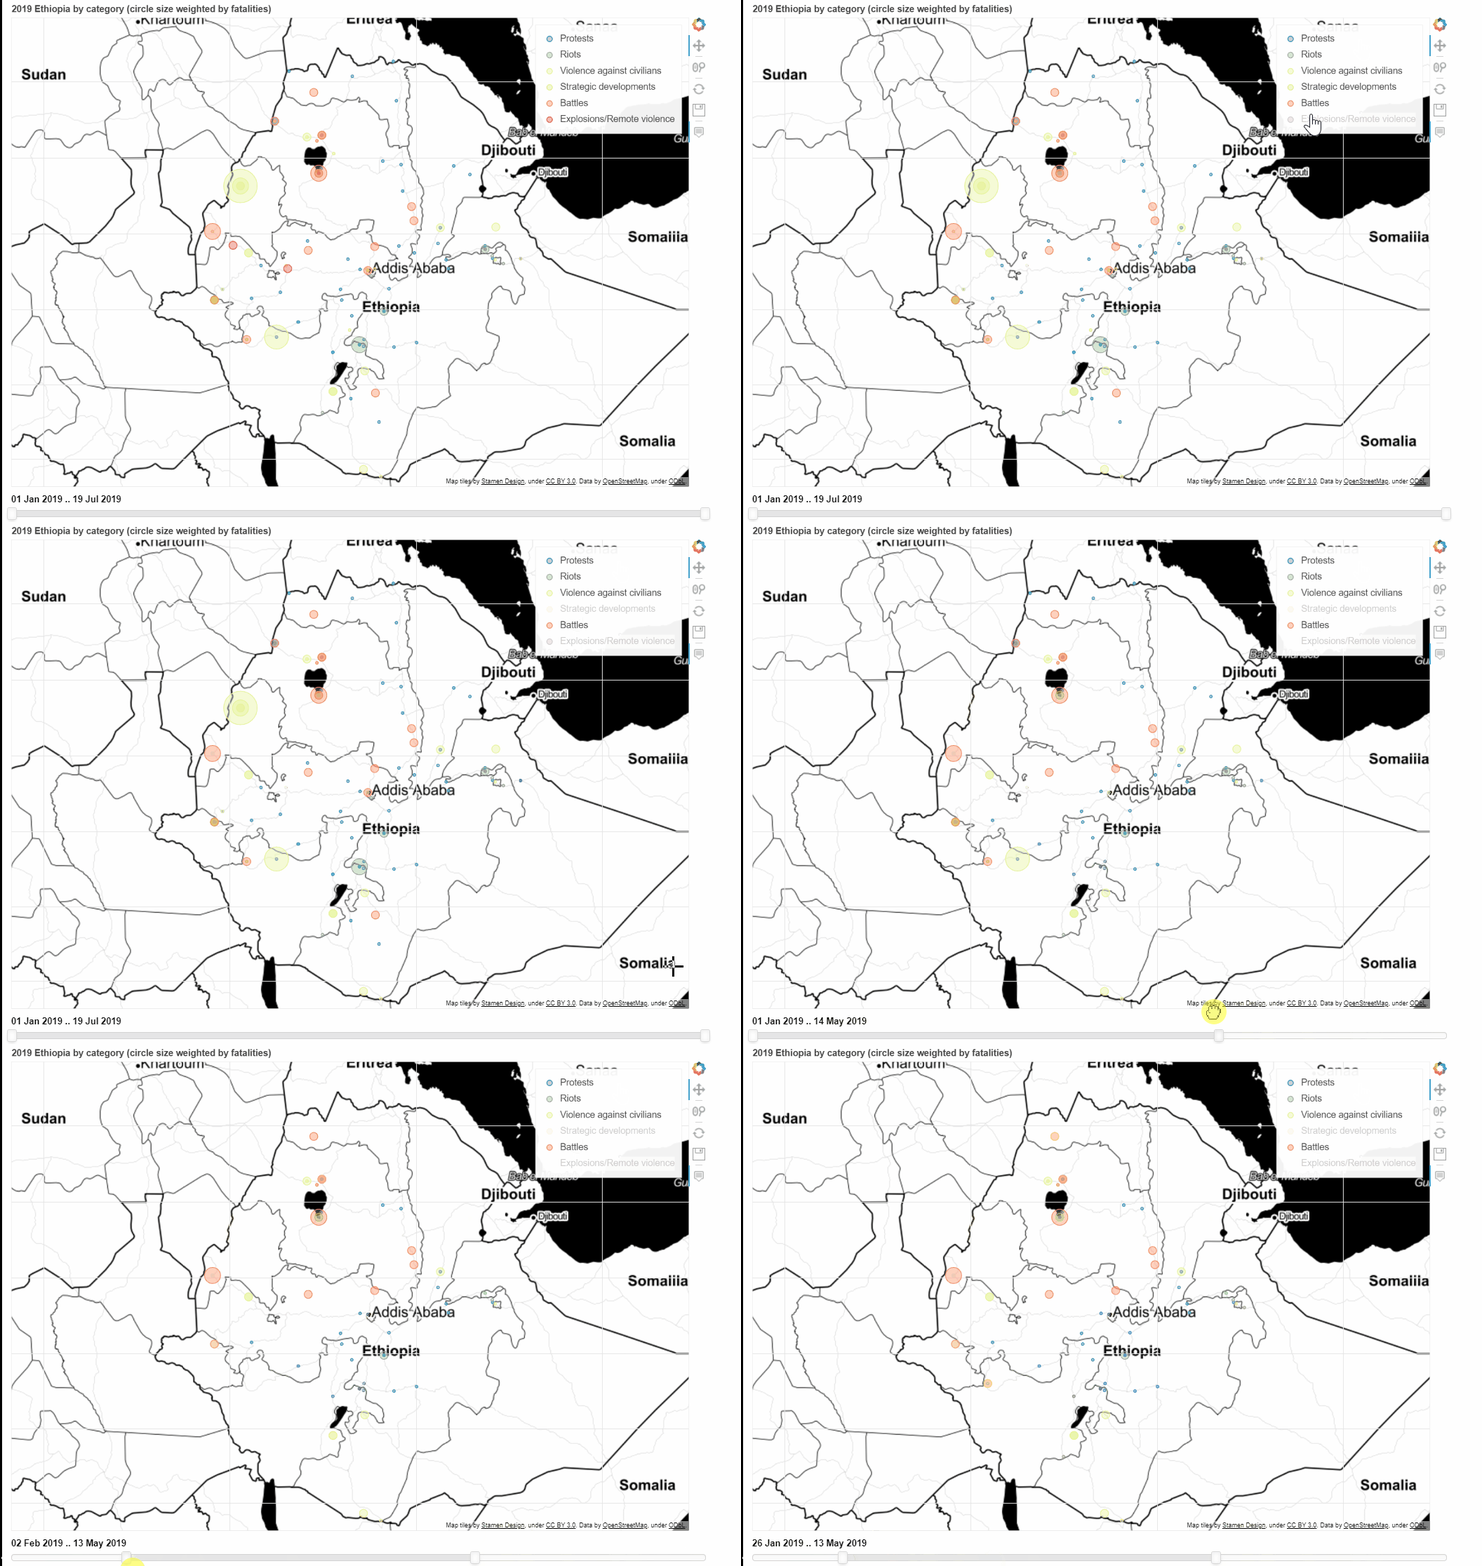
Linking DateRangeSlider to ACLED data on Bokeh map

Hi everyone!

Hopefully you can help me out. I am trying to make a Bokeh map using the ACLED dataset [link to specific dataset]. I can successfully create the map with an interactive legend where the user can hide datapoints by category.

The ACLED dataset also contains information about the date of the event. To make use of this, I wanted to use Bokeh’s DateRangeSlider to render a map that is updated with event data within a specific date range.

This is where I run into problems. The map and DateRangeSlider are successfully rendered into a HTML-file, but I’m struggling to link the two so that the map updates to the date range specified by the DateRangeSlider. For the DateRangeSlider to work, you need to specify some Javascript using CustomJS from the Bokeh package.

Would greatly appreciate some help - you’ll find the relevant Javascript at the bottom of the code. GIF of the map here

Full code below:

import pandas as pd
import numpy as np
import datetime
import warnings
warnings.filterwarnings('ignore')

from bokeh.models import *
from bokeh.models.callbacks import *
from bokeh.plotting import *
from bokeh.io import *
from bokeh.tile_providers import *
from bokeh.palettes import *
from bokeh.transform import *
from bokeh.layouts import *


#See link above
df = pd.read_csv('ethiopia_2019.csv')


#Intiate map scaling and create map
scale = 2000
x=df["x"]
y=df["y"]

x_min=int(x.mean() - (scale*350))
x_max=int(x.mean() + (scale*350))
y_min=int(y.mean() - (scale*350))
y_max=int(y.mean() + (scale*350))

tile_provider = get_provider(STAMEN_TONER)

p = figure(
    title='2019 Ethiopia by category (circle size weighted by fatalities)',
    match_aspect=True, #?
    tools='wheel_zoom, pan, reset, save',
    x_range=(x_min, x_max),
    y_range=(y_min, y_max),
    x_axis_type='mercator',
    y_axis_type='mercator',
    plot_width=1000,
    plot_height=700
)

p.grid.visible=True

m=p.add_tile(tile_provider)

m.level='underlay'

p.xaxis.visible=False
p.yaxis.visible=False

events = list(['Protests', 'Riots', 'Strategic developments', 'Violence against civilians', 'Battles', 'Explosions/Remote violence'])
events

#Creating empty lists to create temporary dataframes for each category

Protests=[]
Strategic_developments=[]
Riots=[]
Battles=[]
Explosions_remote_violence=[]
Violence_against_civilians=[]
list_list=[Protests,Riots,Strategic_developments,Violence_against_civilians,Battles,Explosions_remote_violence]

#New column with radius size of Bokeh circle markers
df.loc[df['fatalities']==0, ['radius']]=4000
df.loc[(df['fatalities']>0) & (df['fatalities']<=10), ['radius']]=12000
df.loc[(df['fatalities']>10) & (df['fatalities']<=30), ['radius']]=24000
df.loc[(df['fatalities']>30) & (df['fatalities'] <=50), ['radius']]=36000
df.loc[(df['fatalities']>50), ['radius']]=50000

#Append data to relevant event_type category
for i in range(len(df['event_type'])):
  if df.loc[i,'event_type']=='Protests':
    Protests.append([df.loc[i,'event_type'],
                     df.loc[i,'x'],df.loc[i,'y'],
                     df.loc[i,'actor1'],
                     df.loc[i,'notes'],
                     df.loc[i,'fatalities'],
                     df.loc[i,'radius'],
                     df.loc[i,'source'],
                     df.loc[i,'event_date'],
                     df.loc[i,'DateTime'],
                     df.loc[i,'location']])
  if df.loc[i,'event_type']=='Riots':
    Riots.append([df.loc[i,'event_type'],
                     df.loc[i,'x'],df.loc[i,'y'],
                     df.loc[i,'actor1'],
                     df.loc[i,'notes'],
                     df.loc[i,'fatalities'],
                     df.loc[i,'radius'],
                     df.loc[i,'source'],
                     df.loc[i,'event_date'],
                     df.loc[i,'DateTime'],
                     df.loc[i,'location']])
  if df.loc[i,'event_type']=='Battles':
    Battles.append([df.loc[i,'event_type'],
                     df.loc[i,'x'],df.loc[i,'y'],
                     df.loc[i,'actor1'],
                     df.loc[i,'notes'],
                     df.loc[i,'fatalities'],
                     df.loc[i,'radius'],
                     df.loc[i,'source'],
                     df.loc[i,'event_date'],
                     df.loc[i,'DateTime'],
                     df.loc[i,'location']])
  if df.loc[i,'event_type']=='Strategic developments':
    Strategic_developments.append([df.loc[i,'event_type'],
                     df.loc[i,'x'],df.loc[i,'y'],
                     df.loc[i,'actor1'],
                     df.loc[i,'notes'],
                     df.loc[i,'fatalities'],
                     df.loc[i,'radius'],
                     df.loc[i,'source'],
                     df.loc[i,'event_date'],
                     df.loc[i,'DateTime'],
                     df.loc[i,'location']])
  if df.loc[i,'event_type']=='Explosions/Remote violence':
    Explosions_remote_violence.append([df.loc[i,'event_type'],
                     df.loc[i,'x'],df.loc[i,'y'],
                     df.loc[i,'actor1'],
                     df.loc[i,'notes'],
                     df.loc[i,'fatalities'],
                     df.loc[i,'radius'],
                     df.loc[i,'source'],
                     df.loc[i,'event_date'],
                     df.loc[i,'DateTime'],
                     df.loc[i,'location']])
  if df.loc[i,'event_type']=='Violence against civilians':
    Violence_against_civilians.append([df.loc[i,'event_type'],
                     df.loc[i,'x'],df.loc[i,'y'],
                     df.loc[i,'actor1'],
                     df.loc[i,'notes'],
                     df.loc[i,'fatalities'],
                     df.loc[i,'radius'],
                     df.loc[i,'source'],
                     df.loc[i,'event_date'],
                     df.loc[i,'DateTime'],
                     df.loc[i,'location']])


#Create circle markers in Bokeh, use hovertools to append info to the markers
for i in range(len(list_list)):
  temp_df=pd.DataFrame(list_list[i],columns=['event_type','x','y','actor1','notes', 'fatalities', 'radius', 'source', 'event_date', 'DateTime', 'location'])
  source=ColumnDataSource(temp_df)
  source2=ColumnDataSource(temp_df)
  circle1=p.circle(x=('x'),y='y',source=source,color=Spectral6[i],line_color=Spectral6[i],legend_label=events[i],hover_color='white',radius='radius', fill_alpha=0.4)

  event_hover = HoverTool(tooltips=[('Location', '@location'),
                                    ('Date', '@event_date'),
                                    ('Fatalities', '@fatalities'),
                                    ('Actor','@actor1'),
                                    ('Category','@event_type'),
                                    ('Description','@notes'),
                                    ('Source', '@source')],
                          mode='mouse',
                          point_policy='follow_mouse',
                          renderers=[circle1],
                          formatters={'DateTime': 'datetime'})
  event_hover.renderers.append(circle1)
  p.tools.append(event_hover)


#Define callback (CustomJS in Bokeh) to use with DateRangeSlider 
##ISSUE: CALLBACK OPTION 1##

#https://stackoverflow.com/questions/64610234/bokeh-custom-js-callback-date-range-slider
callback = CustomJS(args=dict(source=source, ref_source=source2), code="""
    // print out array of date from, date to
    console.log(cb_obj.value); 

    // dates returned from slider are not at round intervals and include time;
    const date_from = Date.parse(new Date(cb_obj.value[0]).toDateString());
    const date_to = Date.parse(new Date(cb_obj.value[1]).toDateString());
    console.log(date_from, date_to)

// Creating the Data Sources
const data = source.data;
const ref = ref_source.data;

// Creating new Array and appending correctly parsed dates
let new_ref = []
ref["DateTime"].forEach(elem => {
    elem = Date.parse(new Date(elem).toDateString());
    new_ref.push(elem);
    console.log(elem);
})

// Creating Indices with new Array
const from_pos = new_ref.indexOf(date_from);
const to_pos = new_ref.indexOf(date_to);


// re-create the source data from "reference"
data["DateTime"] = ref["DateTime"].slice(from_pos, to_pos);
source.change.emit();
""")

#View the maps

p.legend.location = "top_right"
p.legend.click_policy="hide"

date_range_slider = DateRangeSlider(value=(df['DateTime'][len(df['DateTime'])-1], df['DateTime'][0]),
                                    start=df['DateTime'][len(df['DateTime'])-1], end=df['DateTime'][0])
output_file(filename="bokeh.html", title="title")

date_range_slider.js_on_change('value', callback)

layout = column(p, date_range_slider)
output_notebook()
show(layout)

Thanks for providing the .csv, this was a lot easier to troubleshoot with it in hand.

First issue is df[‘DateTime’] is an object not datetime column. Easy fix there. pd.to_datetime is amazing.

My next suggestion is to review bokeh’s filters and CDSView → filters — Bokeh 2.4.2 Documentation

Essentially what you want is a scatter plot that is filtered by values in the date range slider AND you want a legend that can filter by event type. To do that we can use both a single CustomJSFilter (to filter the dates) and a GroupFilter for each event type (to filter the event types). You can run all this off one source with this properly applied, which obviates the need for a lot of your splitting up of the main dataframe and looping through every record in it when creating the renderers.

I’ve rewritten the “bokeh-side” of your code leveraging these features and got rid of the unnecessary splitting up of data. I’ve also demonstrated the use of the factor_cmap to accomplish the color theme as well as showing that you can add multiple renderers to one hovertool if you want them to have the same tooltips (saving you from having a separate hover for each event_type. Read the comments etc and step through it and follow the logic :slight_smile:

import pandas as pd
import numpy as np
import datetime
import warnings
warnings.filterwarnings('ignore')

from bokeh.models import *
from bokeh.models.callbacks import *
from bokeh.plotting import *
from bokeh.io import *
from bokeh.tile_providers import *
from bokeh.palettes import *
from bokeh.transform import *
from bokeh.layouts import *

#See link above
df = pd.read_csv('ethiopia_2019.csv')


#Intiate map scaling and create map
scale = 2000
x=df["x"]
y=df["y"]

x_min=int(x.mean() - (scale*350))
x_max=int(x.mean() + (scale*350))
y_min=int(y.mean() - (scale*350))
y_max=int(y.mean() + (scale*350))

tile_provider = get_provider(STAMEN_TONER)

p = figure(
    title='2019 Ethiopia by category (circle size weighted by fatalities)',
    match_aspect=True, #?
    tools='wheel_zoom, pan, reset, save',
    x_range=(x_min, x_max),
    y_range=(y_min, y_max),
    x_axis_type='mercator',
    y_axis_type='mercator',
    plot_width=1000,
    plot_height=700
)

p.grid.visible=True

m=p.add_tile(tile_provider)

m.level='underlay'

p.xaxis.visible=False
p.yaxis.visible=False

#New column with radius size of Bokeh circle markers
df.loc[df['fatalities']==0, ['radius']]=4000
df.loc[(df['fatalities']>0) & (df['fatalities']<=10), ['radius']]=12000
df.loc[(df['fatalities']>10) & (df['fatalities']<=30), ['radius']]=24000
df.loc[(df['fatalities']>30) & (df['fatalities'] <=50), ['radius']]=36000
df.loc[(df['fatalities']>50), ['radius']]=50000

df['DateTime']=pd.to_datetime(df['DateTime'])

#one columndatasource
src = ColumnDataSource(df)

from bokeh.transform import factor_cmap
from bokeh.models import CDSView, CustomJSFilter
#create factor colormap to map the event_type (categorical) to a palette
mapper = factor_cmap(field_name='event_type',palette=Spectral6,factors = df['event_type'].unique().tolist())

#initializae date range slider here
#probbbbably should be setting start end etc based on df['DateTime'].min() and max() but okay...
date_range_slider = DateRangeSlider(value=(df['DateTime'][len(df['DateTime'])-1], df['DateTime'][0]),
                                    start=df['DateTime'][len(df['DateTime'])-1], end=df['DateTime'][0])
#create a customjs filter that returns the src indices the live between the slider values
filt = CustomJSFilter(args=dict(src=src,date_range_slider=date_range_slider)
                      ,code='''
                      var minDate = date_range_slider.value[0]
                      var maxDate = date_range_slider.value[1]
                      var inds = []
                      //going through every entry DateTime, if it's in between the date range sliders, append to inds
                      for (var i = 0; i<src.data['DateTime'].length; i++){
                              if (src.data['DateTime'][i]>minDate && src.data['DateTime'][i]<maxDate){
                                      inds.push(i)}
                              }
                      return inds'''
                      )                     

#one scatter glyph/renderer for each event type, for the sake of having the legend click policy hide actually work
#https://stackoverflow.com/questions/64883994/all-data-being-remove-from-bokeh-plot-using-click-policy-hide 
# , with circle as marker, the mapper for the fill/line color
# and pointing to the fields in the datasource for the other args
#have each renderer use a view that uses two filters: the date filter and the groupfilter (for only that one specific event)
views= []
rends = []
for et in df['event_type'].unique():
    #create a groupfilter for the event
    gp_filt = GroupFilter(column_name='event_type',group=et)
    #create a cdsview that uses both the date filter and the group filter
    view = CDSView(source=src,filters=[filt,gp_filt])
    rend = p.scatter(x='x',y='y',fill_color=mapper,line_color=mapper,legend_label=et
                    ,hover_color='white',radius='radius',fill_alpha=0.4,source=src,view=view)
    #need to keep track of all the views we create and all the rends we create
    views.append(view)
    rends.append(rend)
    
#tell all the views to update every time the slider values change
date_range_slider.js_on_change('value',CustomJS(args=dict(views=views)
                                                ,code='''
                                                for (var i=0;i<views.length;i++){ 
                                                        views[i].properties.filters.change.emit()
                                                        }'''))
    
#create one hover with all the renderers passed to it    
event_hover = HoverTool(tooltips=[('Location', '@location'),
                                  ('Date', '@event_date'),
                                  ('Fatalities', '@fatalities'),
                                  ('Actor','@actor1'),
                                  ('Category','@event_type'),
                                  ('Description','@notes'),
                                  ('Source', '@source')],
                        mode='mouse',
                        point_policy='follow_mouse',
                        renderers=rends,
                        formatters={'DateTime': 'datetime'})

p.tools.append(event_hover)
p.legend.location = "top_right"
p.legend.click_policy="hide"

layout = column(p, date_range_slider)
# output_notebook()
show(layout)

filts

2 Likes

Brilliant.

You’re a legend!

Still relatively new to python, let alone javascript.

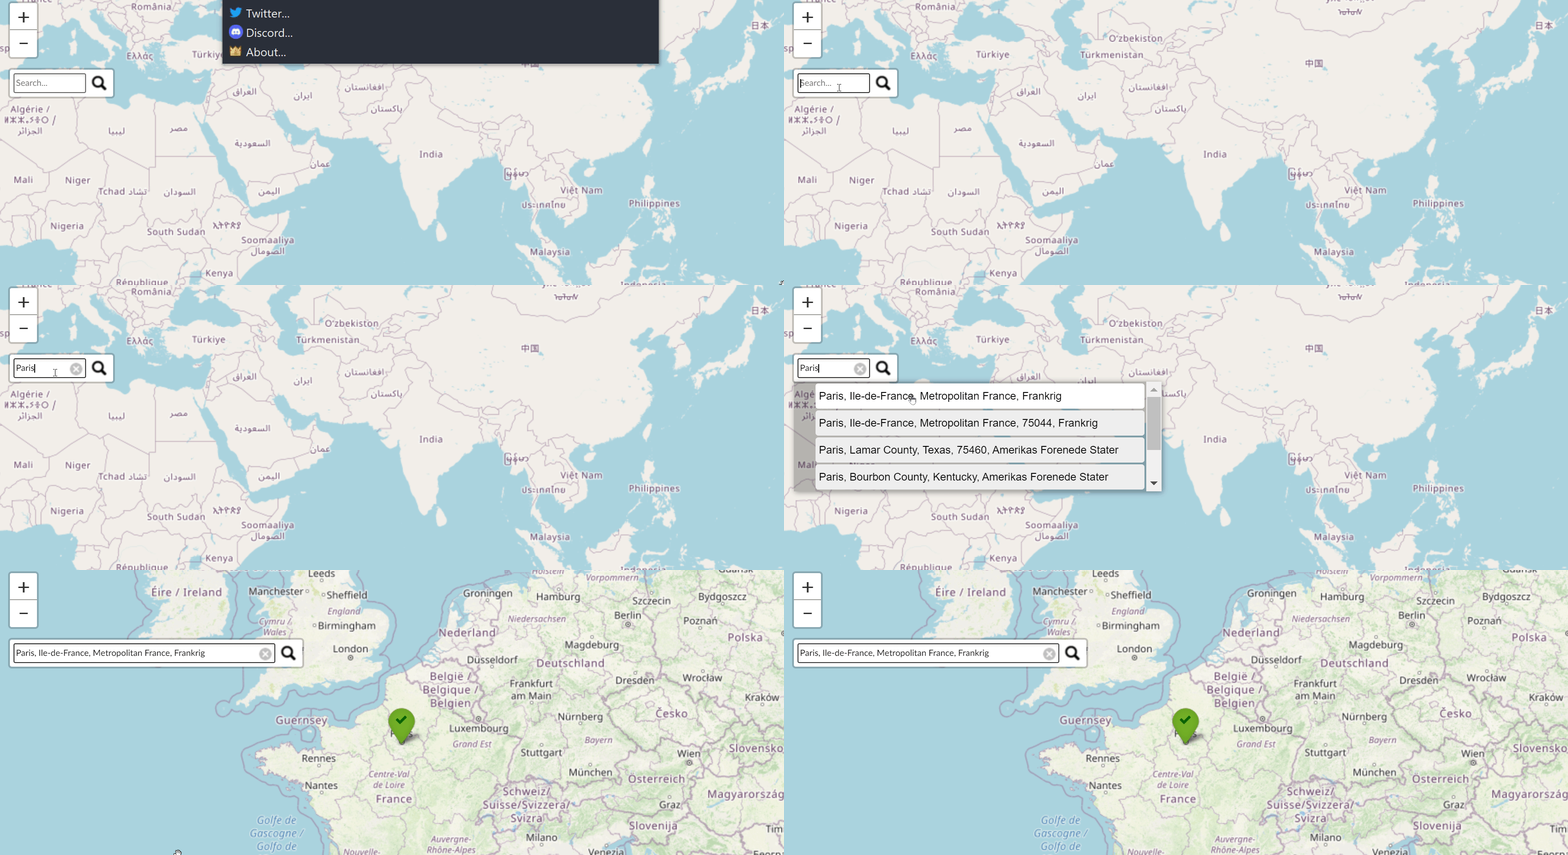
I am toying with the idea of adding a search box to the plot by using the TextInput widget. Do you know any examples of this with Bokeh? I have only seen this functionality with ipyleaflet.

Again, thanks a lot for the help. I had spent a couple of days trying to solve this!

brave_Ku3auk1Swq

from bokeh.models import CustomJS, TextInput

search_box = TextInput(value="", title="Label:")
search_box.js_on_change("value", CustomJS(code="""
    console.log('text_input: value=' + this.value, this.toString())
"""))

#?
q = "https://nominatim.openstreetmap.org/search?q={}&format=json"
r = requests.get(q)

This would be tricky (for me at least, probably trivial for a legit JS dev) to implement, because unless you go the bokeh server route, you’d need to handle those http requests on the JS side. Meaning you’d need to write JS that would do the request, not python. See my explanation here:

Essentially you’d need to utilize a JS library analogous to python’s requests/selenium, figure out how to get coords from that request, then update your plot’s xrange and yrange. Eager to hear other ideas/possibilities though.

1 Like

Yeah, that is definitely beyond my skills at the moment. Maybe in the future.

Thanks again for your help! :slight_smile:

This topic was automatically closed 90 days after the last reply. New replies are no longer allowed.