Hey community,
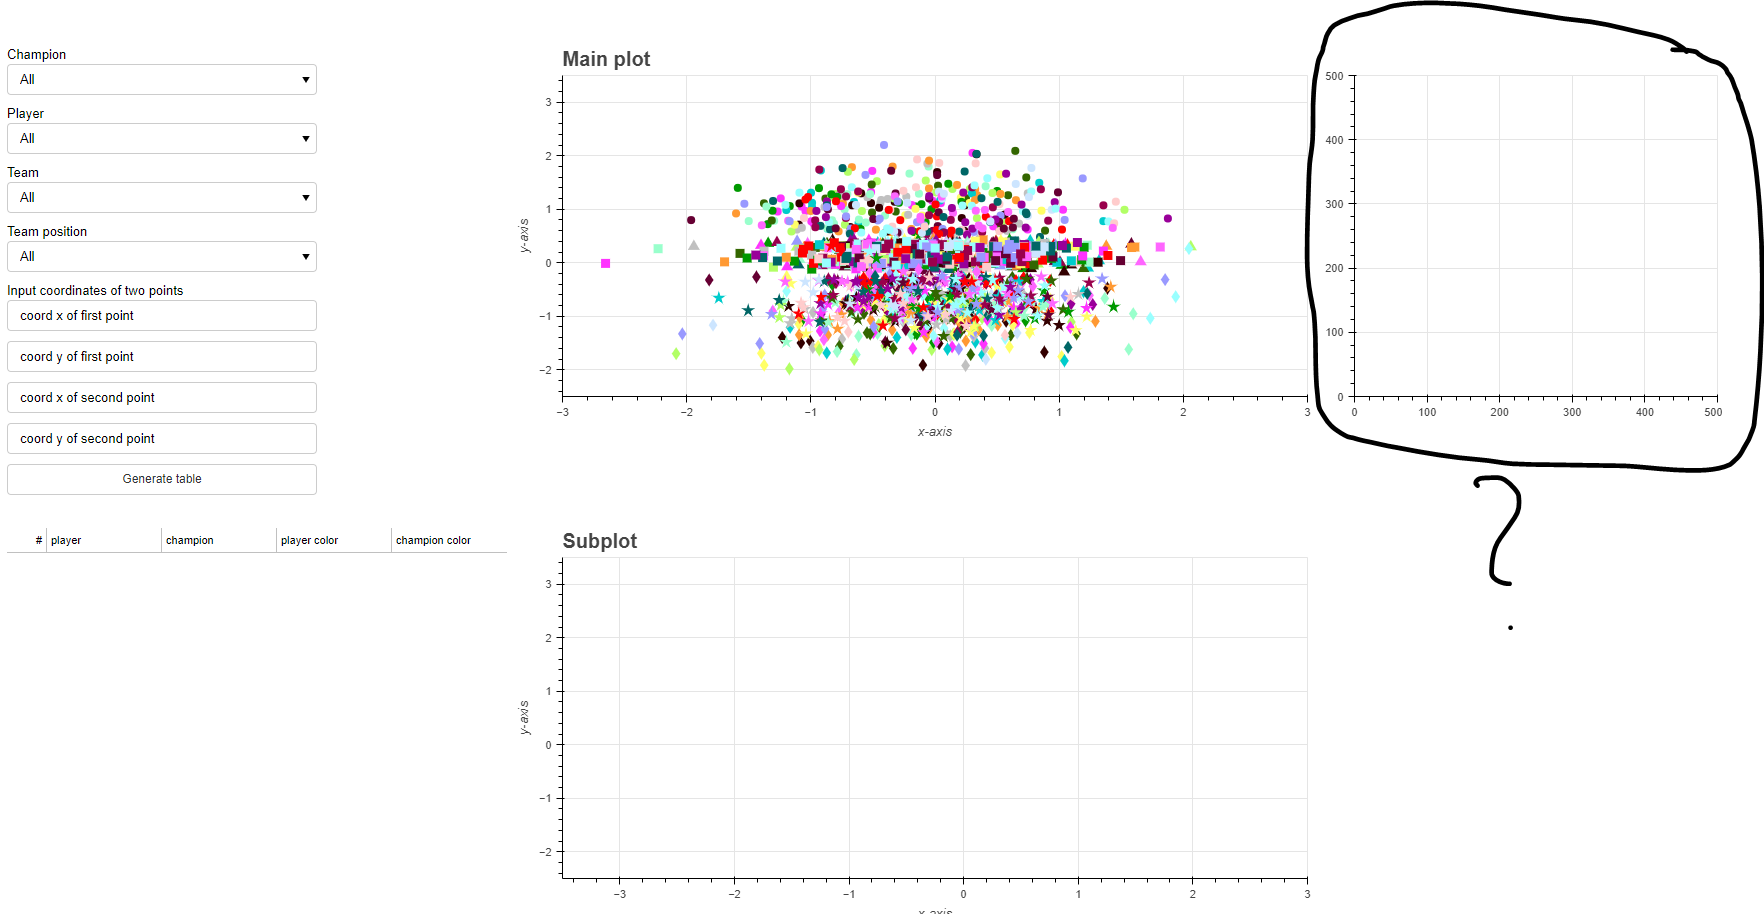
I am trying to add a local png picture to a gridplot. However, the image disappears when it is put into the gridplot, while using show() I am able to display the picture. See attachment for more information.
I can’t put more than 1 picture as I am new, but it works with show()
The code to import the picture looks as follows:
    first_figure = figure(x_range=(0, 500), y_range=(0, 500), plot_height=400, plot_width=400)
    first_figure.image_url(url=[r'plot0.png'],
                           x=0, y=0, w=500, h=500, anchor="bottom_left")
The grid code looks as follow:
    tab1 = Panel(child=gridplot(children=[[main_plot1, first_figure],
                                                               [subplot1, None]]),
                 title='First team analysis')
I also tried using plot, but the result was the same: Able to display it with show(), but nothing appears when it is put into the grid.
I wanted to put reproducible code, but the file is too big, sorry for that 