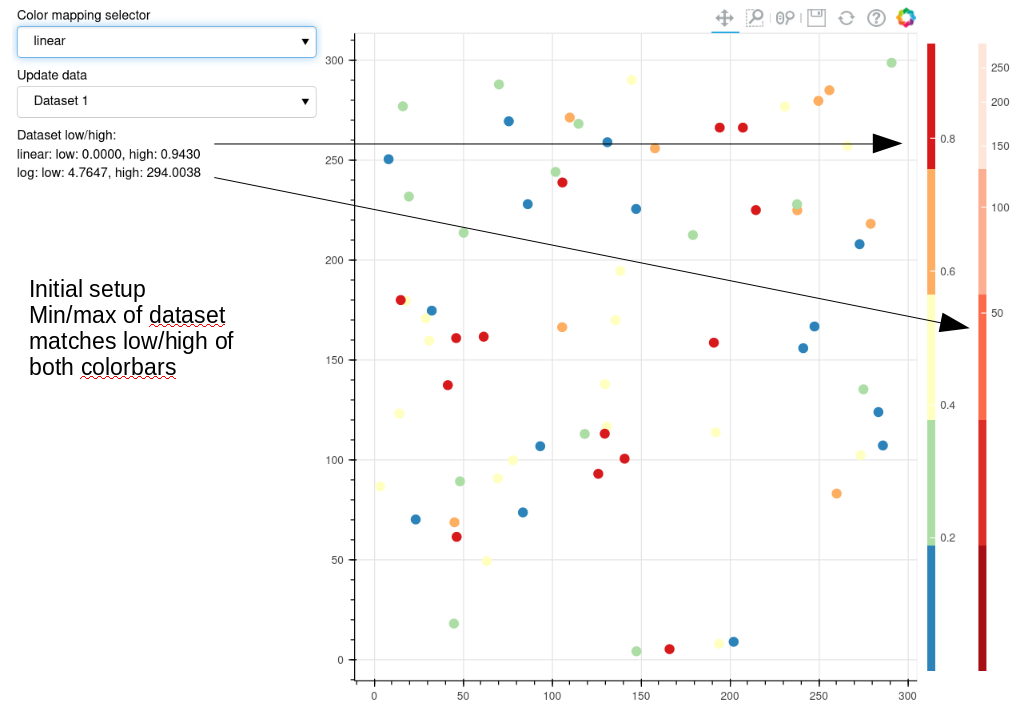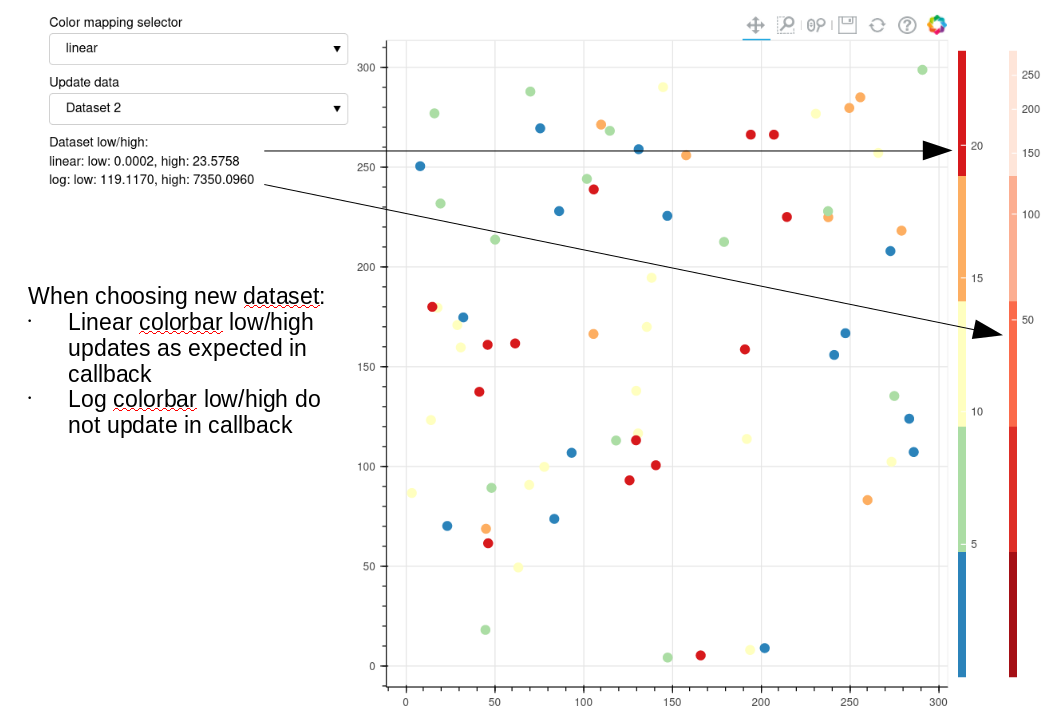
I am trying to update the ColorBar to reflect a change in the data being displayed when the data is updated through a Select widget . I have associated log_cmap mapper to the glyph and the color bar but when updating .color_mapper.low / high the color bar update is not triggered (seems to be triggered next time the data is updated but then based on the old data). For comparison I also have a color bar with linear_cmap mapper, and this seems to update as expected when the on_change callback is executed. Not sure if I am updating the color bar incorrectly?
The example below got a Select widget for updating data, and another widget for choosing the mapper to use to color the data. When choosing to update the data the CDS is updated with new data and the callback for updating colorbar is called.
Running Bokeh 2.3.0, FireFox 78.9, RedHat 7.
#!/usr/bin/env python
import numpy as np
from bokeh.models import ColorBar, ColumnDataSource, NumeralTickFormatter
from bokeh.transform import linear_cmap, log_cmap
from bokeh.io import curdoc
from bokeh.plotting import figure
from bokeh.layouts import row, column
from bokeh.models.widgets import Select, Div
from bokeh.palettes import Spectral5, Reds5


src = ColumnDataSource(data = {'x': [], 'y': [], 'p1': [], 'p2': []})

MAPPER = {
    'linear': linear_cmap(field_name = 'p1', palette = Spectral5, low = 1, high = 6),
    'log': log_cmap(field_name = 'p2', palette = Reds5, low = 1, high = 1000),
}

def create_fig(mappers, title):
    p = figure(plot_width = 700, title = title, toolbar_location = 'above', match_aspect = True)
    p.min_border_left = 80
    p.circle(
        x = 'x', y = 'y', line_color = None,
        color = mappers[map_select.value],
        size=10, source=src, name = 'glyph'
    )
    p.xaxis[0].formatter = NumeralTickFormatter(format = '0')
    p.yaxis[0].formatter = NumeralTickFormatter(format = '0')

    for k,v in mappers.items():
        color_bar = ColorBar(color_mapper=v['transform'], width=8, name = 'color_bar_'+k)
        color_bar.visible = True
        p.add_layout(color_bar, 'right')

        if k != map_select.value:
            color_bar.visible = False

    return p


def color_bar_vis(attr, old, new):
    # callback for mapper select
    # hide and show correct colorbar
    cbar = plot.select(name = 'color_bar_'+old)
    cbar.visible = False

    cbar = plot.select(name = 'color_bar_'+new)
    cbar.visible = True

    # pick new mapper
    new_map = MAPPER[new]

    if new == 'linear':
        data_obj = src.data['p1']
    else:
        data_obj = src.data['p2']

    # update low and high values of mapper
    low = min(data_obj)
    high = max(data_obj)

    # update div widget with low/high of data to be mapped
    txt = 'Low: {:.4f}, high: {:.4f}'.format(low, high)
    info_text.text = txt

    new_map['transform'].low = low
    new_map['transform'].high = high

    cbar.color_mapper.low = low
    cbar.color_mapper.high = high

    r = plot.select(name = 'glyph')
    r.glyph.fill_color = dict(field = new_map['field'], transform = new_map['transform'])


def cb_data_select(attr, old, new):
    # callback for data factor select
    data_val = float(new)

    new_data = np.random.rand(4,70)
    x = new_data[0]*300+2000
    y = new_data[1]*300+3000
    p1 = new_data[2]*data_val / 2.0
    p2 = new_data[3]*data_val

    src.data = {'x': x, 'y': y, 'p1': p1, 'p2': p2}

    # update color mapper and colorbar to updated data
    # force update - assigning .value might not trigger callback
    color_bar_vis('value', map_select.value, map_select.value)


map_select = Select(
    title = 'Select mapper',
    options = list(MAPPER.keys()),
    value = list(MAPPER.keys())[0],
    width = 300
)
map_select.on_change('value', color_bar_vis)

plot = create_fig(MAPPER, 'Mapper from widget')

data_select = Select(
    title = 'Select data scaling factor',
    options = ['2', '50'],
)
data_select.on_change('value', cb_data_select)

info_text = Div(text = '', width = 300)
wdg_col = column(data_select, map_select, info_text)

data_select.value = '2'

curdoc().add_root(row(wdg_col, plot))