OK that’s pretty interesting! I am not sure it will make it in a first cut but it definitely seems worth implementing. Question, does MPL use a default value of ‘linthreshx’ for ‘symlog’? Alternatively, what happens around zero if a user doesn’t supply `linthreshx’? It does not seem to say in the docs.
Bryan
On Apr 4, 2014, at 8:04 PM, Chris Stoughton chris.stoughton@gmail.com wrote:
A small suggestion for logarithmic plots is to also implement symmetric logarithmic scaling.
The matplolib implementation is documented here:
http://matplotlib.org/api/pyplot_api.html
‘symlog’
basex/basey:
The base of the logarithm
linthreshx/linthreshy:
The range (-x, x) within which the plot is linear (to avoid having the plot go to infinity around zero).
subsx/subsy:
Where to place the subticks between each major tick. Should be a sequence of integers. For example, in a log10 scale: [2, 3, 4, 5,6, 7, 8, 9]
will place 8 logarithmically spaced minor ticks between each major tick.
linscalex/linscaley:
This allows the linear range (-linthresh to linthresh) to be stretched relative to the logarithmic range. Its value is the number of decades to use for each half of the linear range. For example, when linscale== 1.0 (the default), the space used for the positive and negative halves of the linear range will be equal to one decade in the logarithmic range.
On Wed, Apr 2, 2014 at 8:48 AM, Mark Benedict markdbenedict@gmail.com wrote:
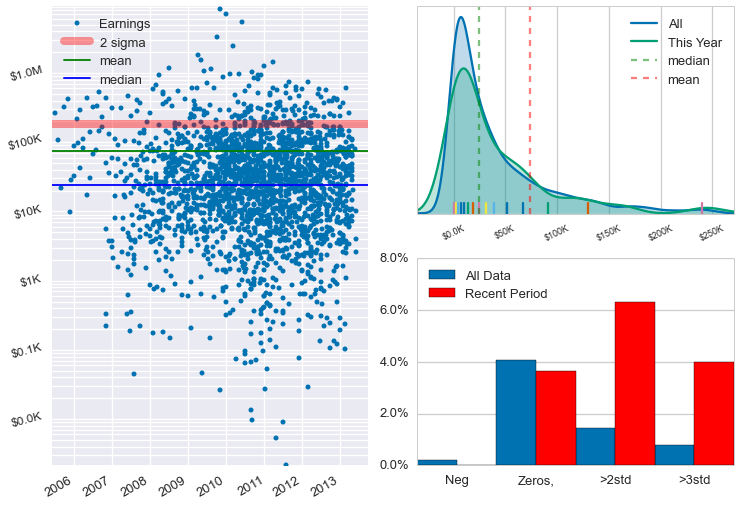
I am trying to plot some financial data using a logarithmic scale. I can transform the data in numpy easily enough, but I can’t seem to figure out how to change the tick labels to something more user friendly. I really don’t want to show 10^0 - 10^6 but would much rather format the displayed text as $1.00 - $1.0M etc.
Also, The data is coming from a pandas datetime series, and I have had to extract the year and month and create a decimal representation (2012.2 for march 2012) to get a reasonable axis for the plot. Can anyone suggest a more direct route? I see pandas data sources/plots objects in the source and time series related properties in the axis classes but I can’t find any demos or docs that would help me figure out how to use them.
Ideally, I would like to create a scatter plot like the one in the attached image.
Thanks.
Mark Benedict
–
You received this message because you are subscribed to the Google Groups “Bokeh Discussion - Public” group.
To unsubscribe from this group and stop receiving emails from it, send an email to bokeh+unsubscribe@continuum.io.
To post to this group, send email to bokeh@continuum.io.
To view this discussion on the web visit https://groups.google.com/a/continuum.io/d/msgid/bokeh/554235c4-9fd4-4d98-8efd-a5811bfdaf90%40continuum.io.
For more options, visit https://groups.google.com/a/continuum.io/d/optout.
–
You received this message because you are subscribed to the Google Groups “Bokeh Discussion - Public” group.
To unsubscribe from this group and stop receiving emails from it, send an email to bokeh+unsubscribe@continuum.io.
To post to this group, send email to bokeh@continuum.io.
–
You received this message because you are subscribed to the Google Groups “Bokeh Discussion - Public” group.
To unsubscribe from this group and stop receiving emails from it, send an email to bokeh+unsubscribe@continuum.io.
To post to this group, send email to bokeh@continuum.io.