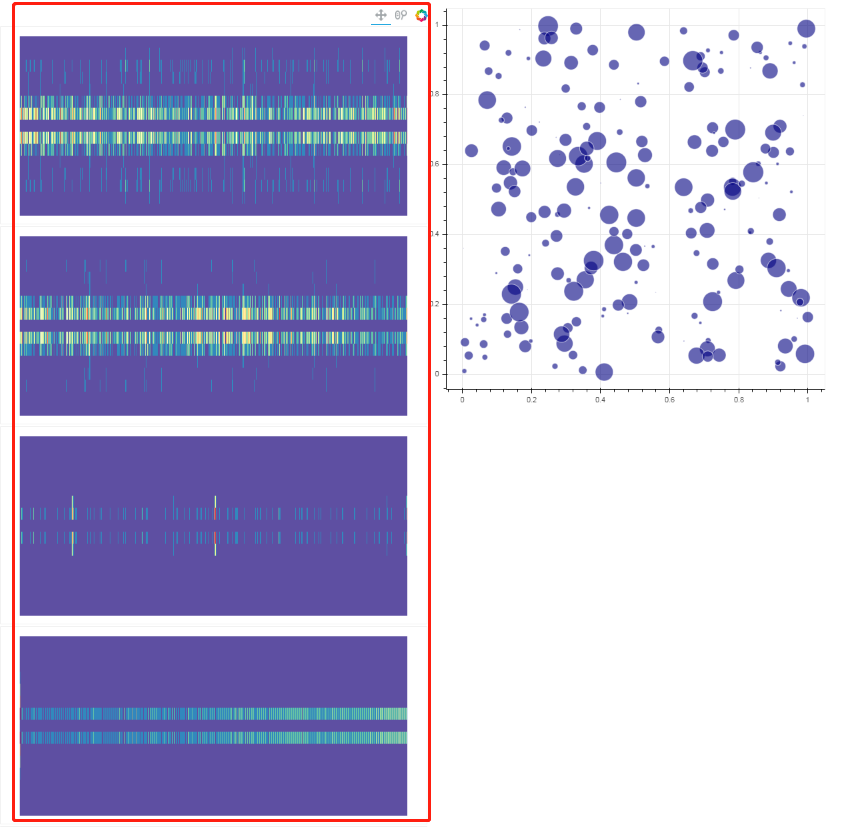
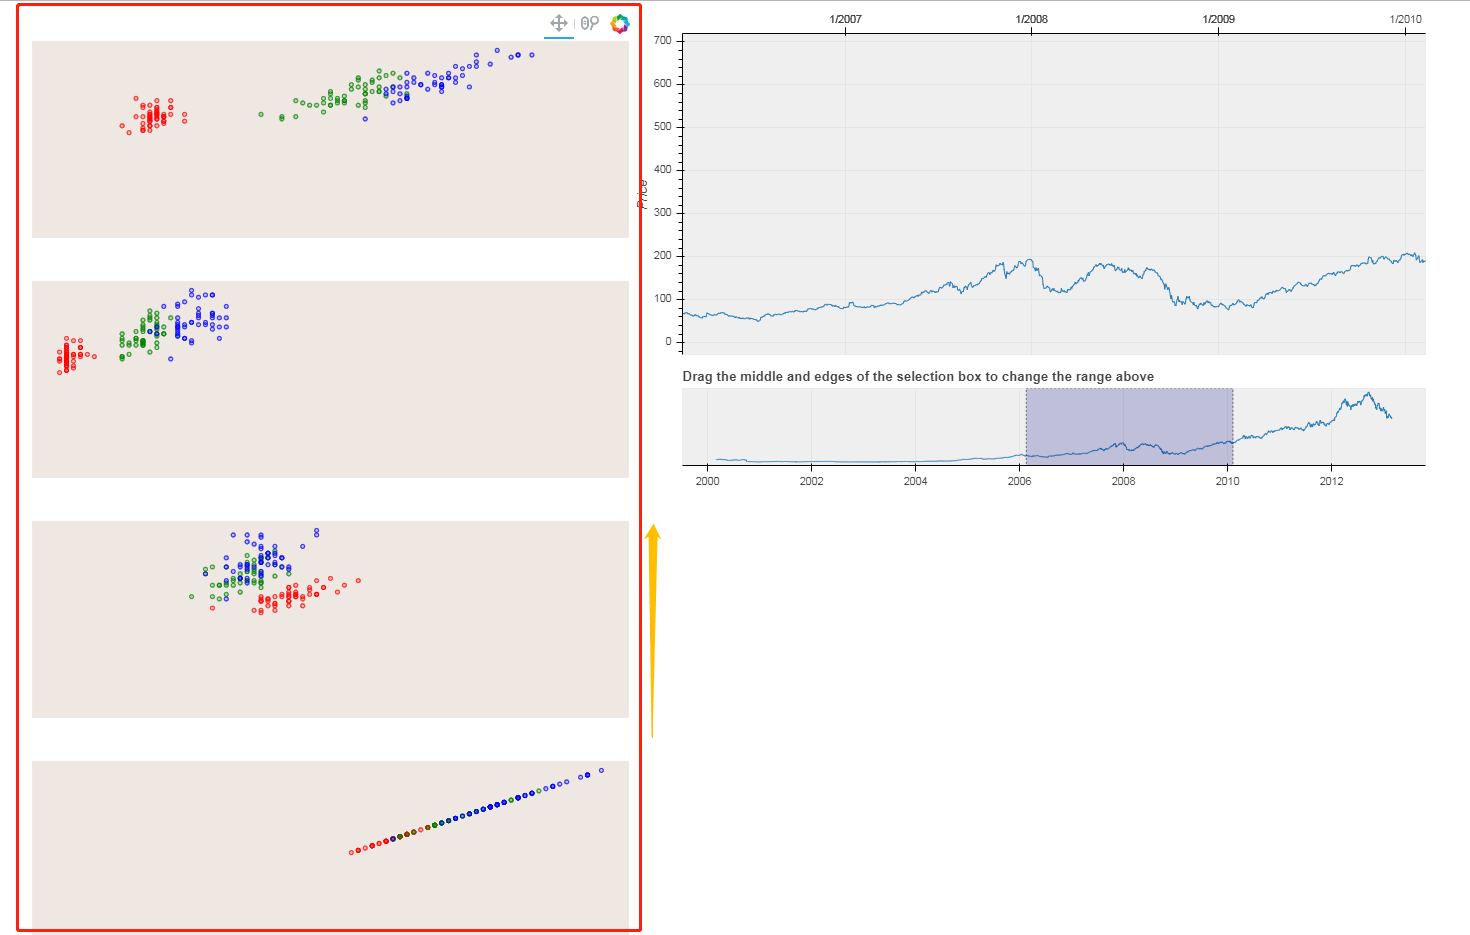
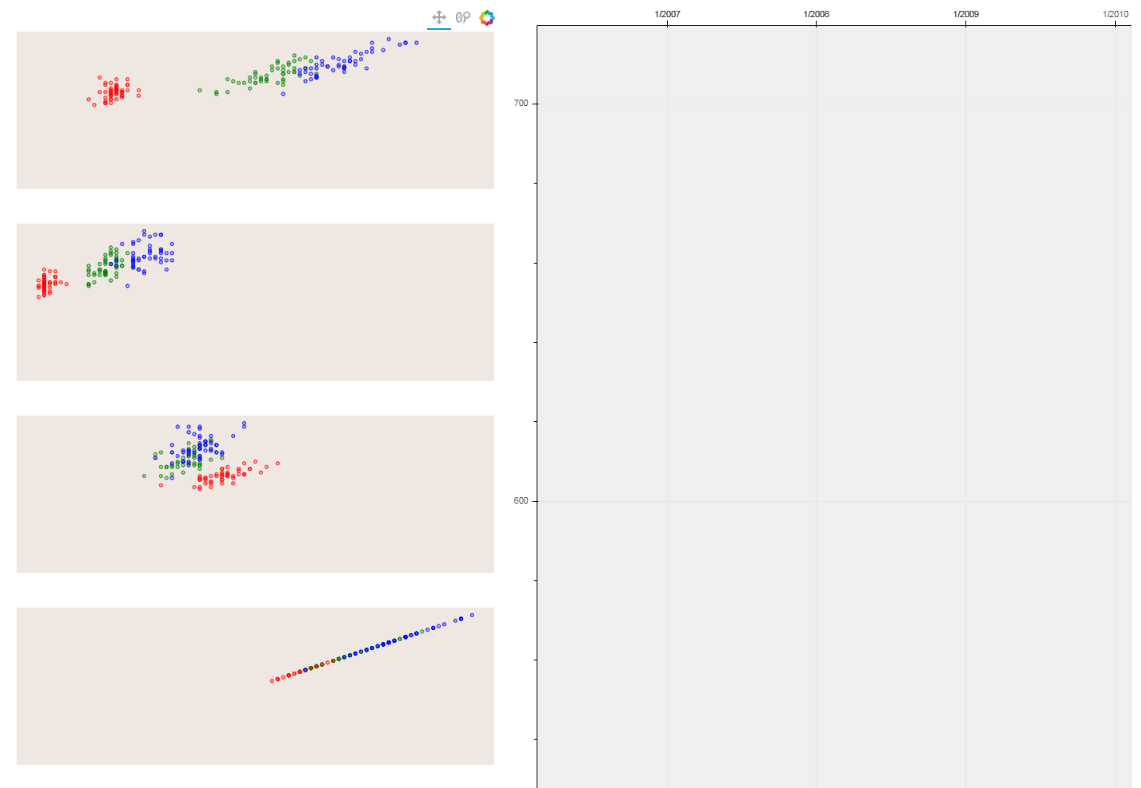
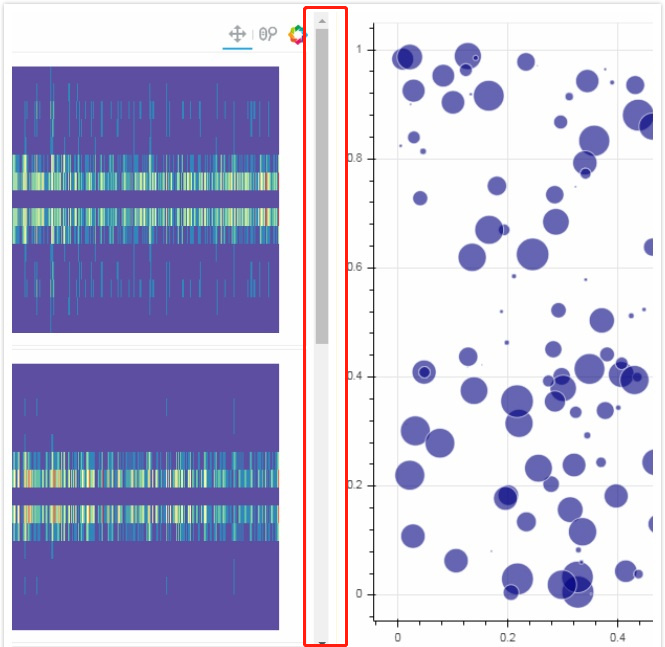
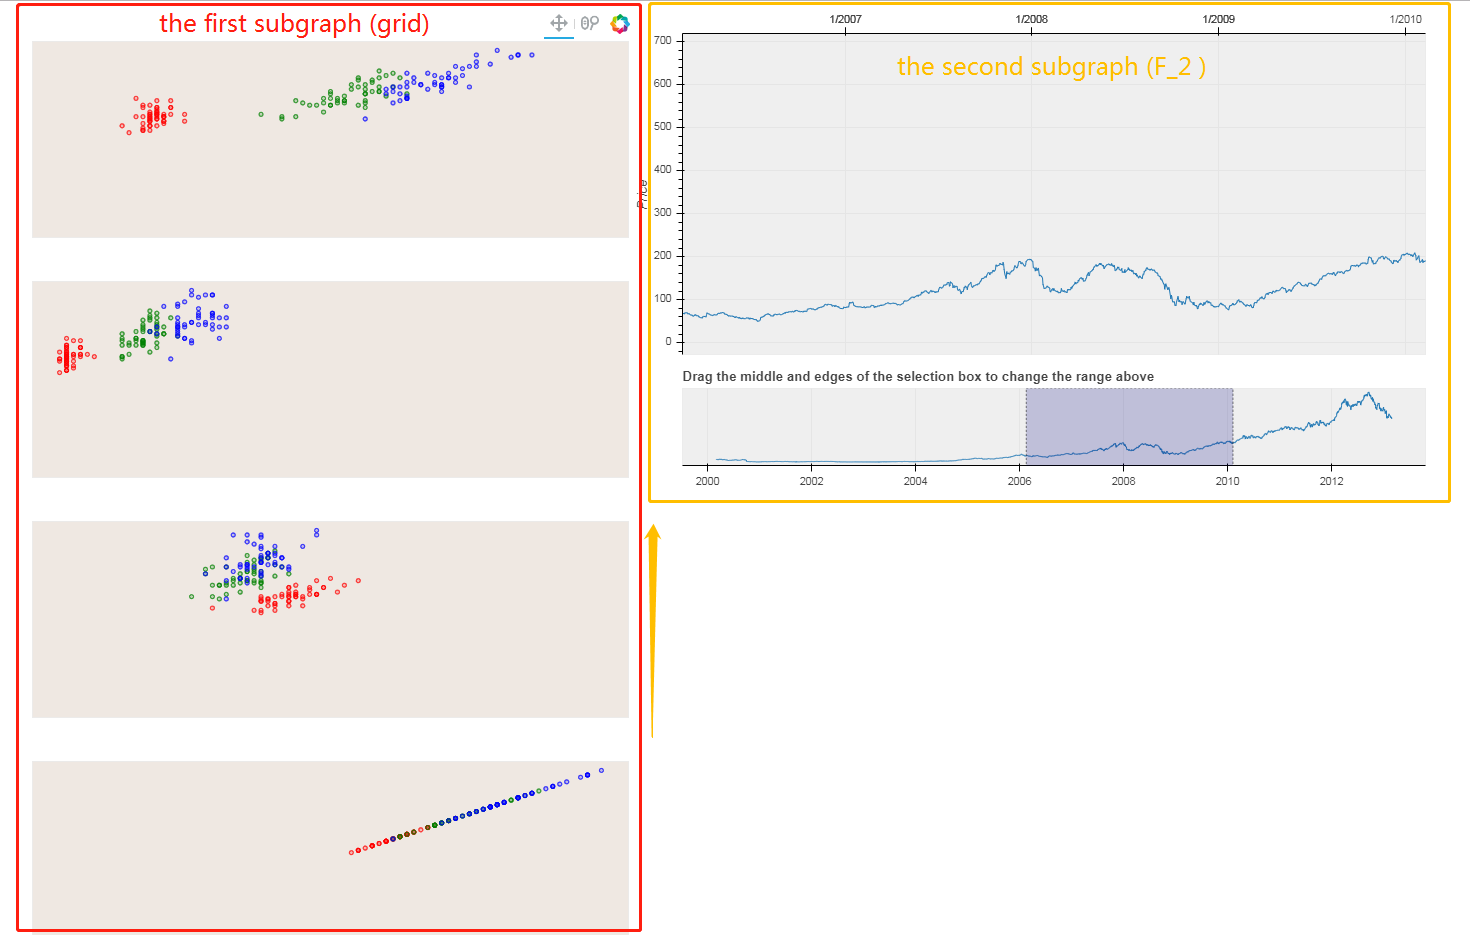
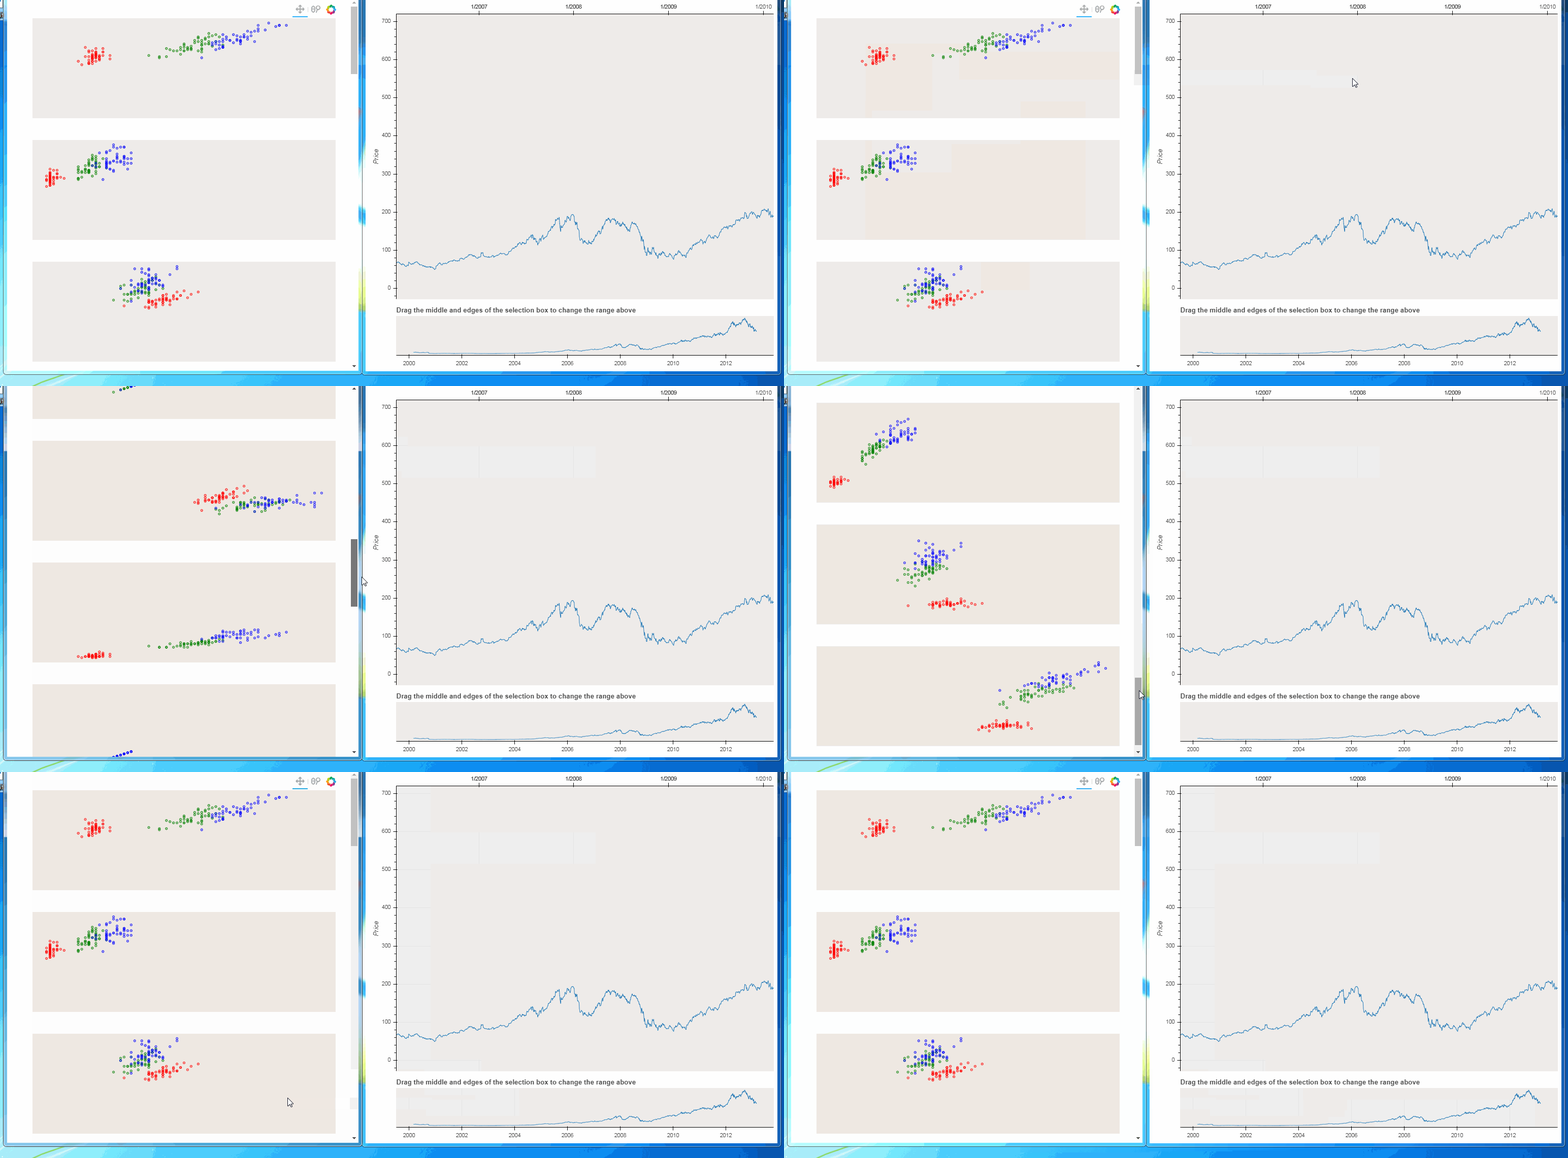
Here’s an example I quoted from the official website.
import numpy as np
from bokeh.plotting import figure
from bokeh.io import curdoc, show
from bokeh.layouts import gridplot, column,row
from bokeh.models.glyphs import Circle
from bokeh.models import (BasicTicker, ColumnDataSource, Grid, LinearAxis,
                          DataRange1d, PanTool, Plot, WheelZoomTool, RangeTool)
from bokeh.sampledata.iris import flowers
from bokeh.sampledata.stocks import AAPL

#############################################################################################################
#                                                     1                                                     #
#############################################################################################################
colormap = {'setosa': 'red', 'versicolor': 'green', 'virginica': 'blue'}

flowers['color'] = flowers['species'].map(lambda x: colormap[x])

source = ColumnDataSource(data=dict(petal_length=flowers['petal_length'],
                                    petal_width=flowers['petal_width'],
                                    sepal_length=flowers['sepal_length'],
                                    sepal_width=flowers['sepal_width'],
                                    color=flowers['color']))

xdr = DataRange1d(bounds=None)
ydr = DataRange1d(bounds=None)


def make_plot(xname, yname, xax=False, yax=False):
    mbl = 40
    mbb = 40
    plot = Plot(x_range=xdr,
                y_range=ydr,
                background_fill_color="#efe8e2",
                border_fill_color='white',
                plot_width=600 + mbl,
                plot_height=200 + mbb,
                min_border_left=2 + mbl,
                min_border_right=2,
                min_border_top=2,
                min_border_bottom=2 + mbb)

    circle = Circle(x=xname,
                    y=yname,
                    fill_color="color",
                    fill_alpha=0.2,
                    size=4,
                    line_color="color")
    r = plot.add_glyph(source, circle)

    xdr.renderers.append(r)
    ydr.renderers.append(r)

    plot.add_tools(PanTool(), WheelZoomTool())

    return plot


xattrs = ["petal_length", "petal_width", "sepal_width", "sepal_length"]
yattrs = list(reversed(xattrs))
plots = []

for y in yattrs:
    rows = []
    for x in xattrs:
        xax = (y == yattrs[-1])
        yax = (x == xattrs[0])
        plot = make_plot(x, y, xax, yax)
        rows.append([plot])
    plots.extend(rows)
grid = gridplot(plots)
#############################################################################################################
#                                                     2                                                     #
#############################################################################################################

dates = np.array(AAPL['date'], dtype=np.datetime64)
source = ColumnDataSource(data=dict(date=dates, close=AAPL['adj_close']))

p = figure(plot_height=350,
           plot_width=800,
           tools="xpan",
           toolbar_location=None,
           x_axis_type="datetime",
           x_axis_location="above",
           background_fill_color="#efefef",
           x_range=(dates[1500], dates[2500]))

p.line('date', 'close', source=source)
p.yaxis.axis_label = 'Price'

select = figure(
    title=
    "Drag the middle and edges of the selection box to change the range above",
    plot_height=130,
    plot_width=800,
    y_range=p.y_range,
    x_axis_type="datetime",
    y_axis_type=None,
    tools="",
    toolbar_location=None,
    background_fill_color="#efefef")

range_tool = RangeTool(x_range=p.x_range)
range_tool.overlay.fill_color = "navy"
range_tool.overlay.fill_alpha = 0.2

select.line('date', 'close', source=source)
select.ygrid.grid_line_color = None
select.add_tools(range_tool)
select.toolbar.active_multi = range_tool

F_2 = column(p, select)

curdoc().add_root(row(grid,F_2))