On Apr 21, 2016, at 1:58 PM, [email protected] wrote:
Hi Bryan,
Thanks for your quick reply.
It may be that I am doing something wrong.
I just only found out that after I see that server message (PATCH-DOC) it goes wrong...
Here is my code:
======== CODE START ===================
d_np = [np.datetime64(datetime.now()).astype(long) / 1000]
data_now = monitor.get_data()
if data_now and 'price' in data_now:
price_now = float(data_now['price'])

volume_now = float(data_now['volume'])

price_last_close = price_now - float(data_now['priceChange'])
plot = figure(plot_width = 1200, plot_height = 400, x_axis_type = "datetime", tools = 'pan,box_select,crosshair,resize,reset,wheel_zoom,hover')
main_line = plot.line(np.array(d_np), [price_now], name = 'main_line', color = "#00BFFF", legend = 'price')
bullet_line = plot.circle(np.array(d_np), [price_now], name = 'main_bullets', color = "#00BFFF")
plot.title = data_now['name']
plot.legend.location = "top_left"
plot.xaxis.axis_label = 'Time'
plot.yaxis.axis_label = 'Price'
plot.grid.bounds = (15000, 18000)
plot.y_range = Range1d(start = price_now - ((1 * price_last_close) / 100), end = price_last_close + ((1 * price_last_close) / 100))
plot.x_range = Range1d(start = np.datetime64(datetime.now() - timedelta(hours = 1)).astype(long) / 1000, end = np.datetime64(datetime.now() + timedelta(hours = 2)).astype(long) / 1000)
plot_volume = figure(plot_width = 1200, plot_height = 400, x_range = plot.x_range, x_axis_type = "datetime", tools = 'pan,box_select,crosshair,resize,reset,wheel_zoom,hover')
volume_line = plot_volume.segment(x0 = np.array(d_np), y0 = [0], x1 = np.array(d_np), y1 = [volume_now], name = 'volume_line', color = "#FF1493")
plot_volume.title = data_now['name']
plot_volume.legend.location = "top_left"
plot_volume.xaxis.axis_label = 'Time'
plot_volume.yaxis.axis_label = 'Volume'
plot_volume.y_range = Range1d(start = 0, end = 0.1)
volume_line_glyph = volume_line.glyph
main_line_glyph = main_line.glyph
name = data_now['price'] + " (" + data_now['priceChangePercent'] + "%)"
plot.text(x = np.array(d_np), y = [price_now], text = [name], text_color = (['red'] if '-' in data_now['priceChangePercent'] else ['green']), name = "text_description")
time_data = [datetime.today() - timedelta(days = 5), datetime.today() + timedelta(days = 5)] # draw close_rate line over +/- 5 days (10 days)
d_np = [np.datetime64(dd).astype(long) / 1000 for dd in time_data]
plot.line (np.array(d_np), [price_last_close, price_last_close], name = 'close_line', color = "#8B008B", legend = 'price')
plots = gridplot([[plot, None], [plot_volume, None]], toolbar_location = "above")
show(plots)
#################################################################################
#################################################################################
renderer_main_line = plot.select(dict(name = "main_line"))
ds_main_line = renderer_main_line[0].data_source
renderer_main_bullets = plot.select(dict(name = "main_bullets"))
ds_main_bullets = renderer_main_bullets[0].data_source
renderer_text_description = plot.select(dict(name = "text_description"))
ds_text_description = renderer_text_description[0].data_source
renderer_volume_line = plot_volume.select(dict(name = "volume_line"))
ds_volume_line = renderer_volume_line[0].data_source
last_y_value = None
last_volume = None
#################################################################################
#################################################################################
def update():
global plot_volume

global last_y_value

global last_volume

global ds_main_line

global ds_main_bullets

global ds_text_description

global ds_volume_line
new_data = monitor.get_data()
if new_data:

    new_volume = float(new_data['volume'])

    new_y_value = float(new_data['price'])

   y_value_difference = 0

    if last_y_value:

        y_value_difference = new_y_value - last_y_value

    volume_difference = 0

    if last_volume and new_volume != last_volume:

        volume_difference = new_volume - last_volume

    last_volume = new_volume

    last_y_value = new_y_value

    d_np = [np.datetime64(datetime.now()).astype(long) / 1000]

    python_array = np.array(ds_main_line.data["x"]).tolist()

    new_x_value = np.datetime64(datetime.now()).astype(long) / 1000

     python_array.append(new_x_value)

    ds_main_line.data["x"] = np.array(python_array)

     ds_main_line.data["y"].append(new_y_value)

    name = new_data['price'] + " (" + new_data['priceChangePercent'] + "%)"

     ds_main_bullets.data["x"] = np.array(d_np)

     ds_main_bullets.data["y"] = [new_y_value]

    if '-' in str(new_data['priceChangePercent']):

        main_line_color = "#EE2233"

    else:

        main_line_color = "#1E9C3D"

    main_line_glyph.line_color = main_line_color

    if volume_difference:

        if y_value_difference > 0:

            volume_color = "#1E9C3D"

        elif y_value_difference < 0:

            volume_color = "#EE2233"

        else:

             volume_color = "#000000"

        volume_line_glyph.line_color = volume_color

       ds_volume_line.data["x0"] = ds_main_line.data["x"]

        ds_volume_line.data["y0"].append(0)

        ds_volume_line.data["x1"] = ds_main_line.data["x"]

        ds_volume_line.data["y1"].append(volume_difference)

    ds_text_description.data['x'] = np.array(d_np)

     ds_text_description.data['y'] = [new_y_value + (0.1 * new_y_value / 100)]

   if '-' in str(new_data['priceChangePercent']):

        quote_info_color = "#EE2233"

    else:

        quote_info_color = "#1E9C3D"

    ds_text_description.data['text'] = [name]

    ds_text_description.data['text_color'] = [quote_info_color]

   ds_main_line.data.update(x = np.array(python_array))

   ds_volume_line.data.update(x0 = np.array(python_array))

    ds_volume_line.data.update(x1 = np.array(python_array))

time.sleep(3.5)
####################################################################################
####################################################################################
session = push_session(curdoc())
curdoc().add_periodic_callback(update, 30)
session.show() # open the document in a browser
session.loop_until_closed()
======== CODE END ====================
On Thursday, April 21, 2016 at 6:51:18 PM UTC+2, Bryan Van de ven wrote:
Hi Tony,
PATCH-DOC is the message sent from the server to the client, that tells the client to actually update things like data, so those messages are entirely expected.
It's going to be extremely difficult or impossible to offer specific help or guidance without knowing details of what exactly you have tried. Is it possible you can share some code that reproduces what you are seeing?
Thanks,
Bryan
> On Apr 21, 2016, at 11:46 AM, dek...@gmail.com wrote:
>
> Hi all,
>
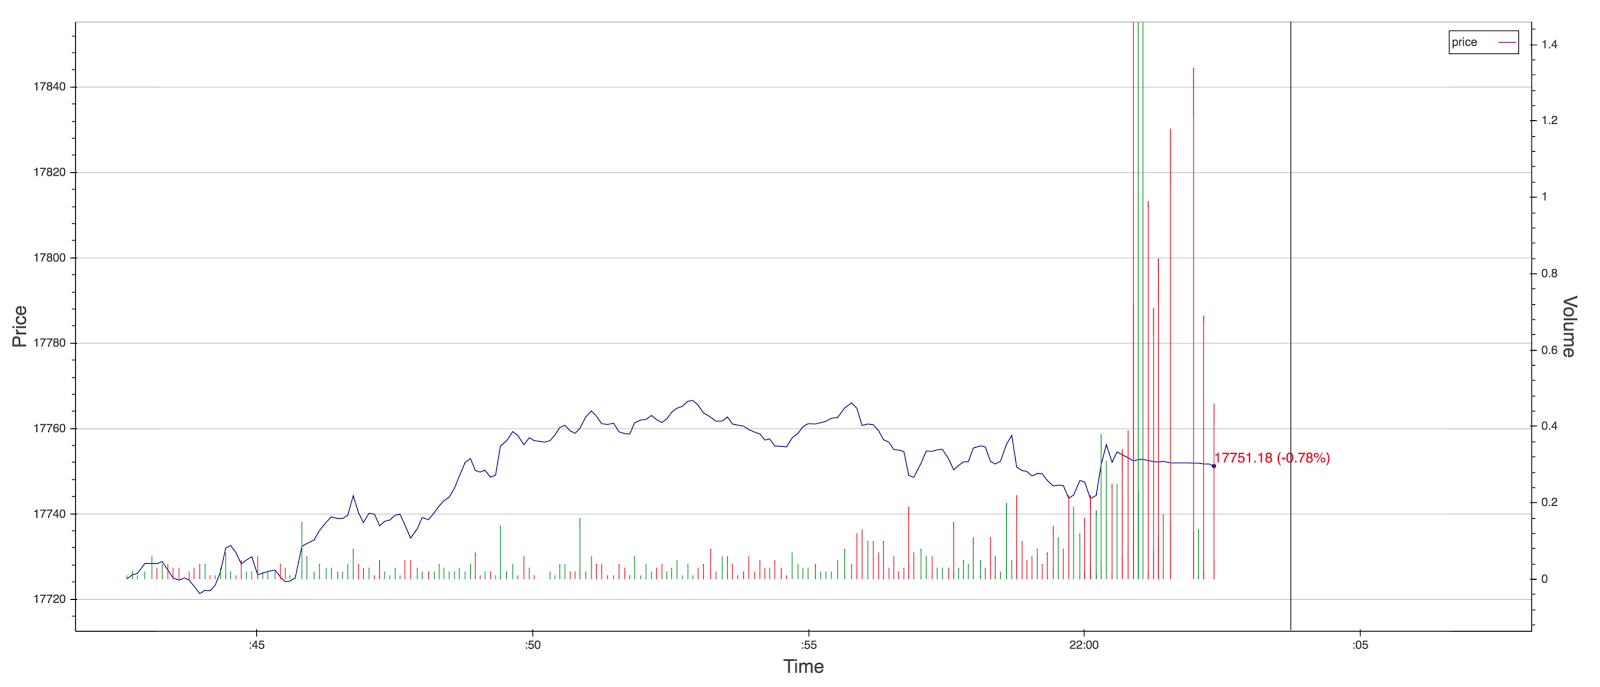
> I am having a problem with my online plot that is being updated with new data each 5 seconds.
> The plots draws a stock price and its volume.
>
> Unfortunately from time to time the data gets lost so I am loosing all the lines drawn before that error happens.
> When I log data I see these few lines:
>
> DEBUG:bokeh.client.connection:Got PATCH-DOC, applying to session
>
> DEBUG:bokeh.client.connection:Sent Message 'PATCH-DOC' (revision 1) [305 bytes]
>
> DEBUG:bokeh.client.connection:Sent Message 'PATCH-DOC' (revision 1) [280 bytes]
>
> DEBUG:bokeh.client.connection:Sent Message 'PATCH-DOC' (revision 1) [348 bytes]
>
> DEBUG:bokeh.client.connection:Sent Message 'PATCH-DOC' (revision 1) [305 bytes]
>
> DEBUG:bokeh.client.connection:Sent Message 'PATCH-DOC' (revision 1) [12246 bytes]
>
> DEBUG:bokeh.client.connection:Running state CONNECTED_AFTER_ACK
>
>
>
> Normally only a few of these lines are there:
>
> DEBUG:bokeh.client.connection:Sent Message 'PATCH-DOC' (revision 1) [305 bytes]
>
>
>
> So this line seems to be messing up everything:
>
> DEBUG:bokeh.client.connection:Got PATCH-DOC, applying to session
>
>
>
> Does anybody knows why bokeh server is issuing the PATCH-DOC message?
>
> This messes up everything and plot gets lost all the data and the plotting starts again from the scratch.
>
>
>
> Thank you for your response.
>
>
>
> Tony
>
>
>
>
> --
> You received this message because you are subscribed to the Google Groups "Bokeh Discussion - Public" group.
> To unsubscribe from this group and stop receiving emails from it, send an email to bokeh+un...@continuum.io.
> To post to this group, send email to bo...@continuum.io.
> To view this discussion on the web visit https://groups.google.com/a/continuum.io/d/msgid/bokeh/65d95ae7-b8a1-4efd-93d3-1840f5c53f45%40continuum.io\.
> For more options, visit https://groups.google.com/a/continuum.io/d/optout\.
--
You received this message because you are subscribed to the Google Groups "Bokeh Discussion - Public" group.
To unsubscribe from this group and stop receiving emails from it, send an email to [email protected].
To post to this group, send email to [email protected].
To view this discussion on the web visit https://groups.google.com/a/continuum.io/d/msgid/bokeh/df0dab0e-7f8e-4b58-abcb-c96b2cbb42e7%40continuum.io\.
For more options, visit https://groups.google.com/a/continuum.io/d/optout\.