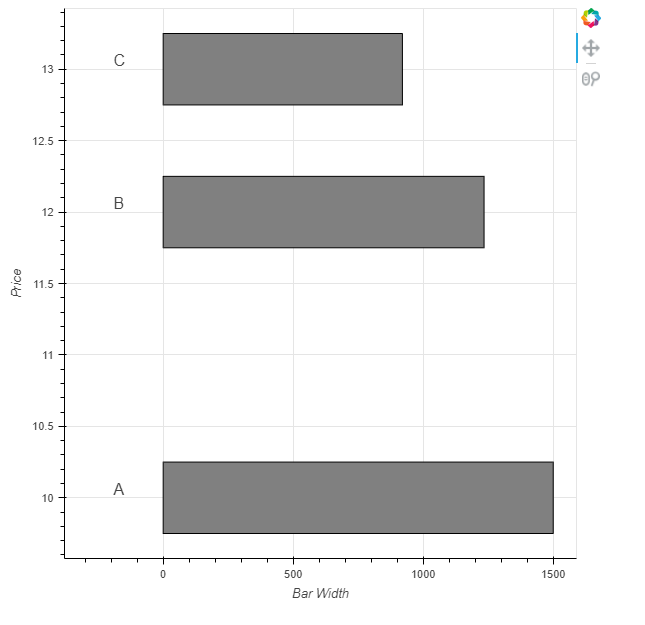
Hey! I’m have a little problem
I have two sets of data, (which have the same y part but different x parts) I would like them to look as if they have the same x part. Is this possible?
The first part of my data is just text, the second part is horizontal bars, I know we need to add extra axes somehow, but the problem is I don’t know how to scale them, and I also don’t know what the maximum range is (although if we can’t do without it, we can set it to 1,000,000)
Here is an example on the picture that shows what you would like to have at the end:
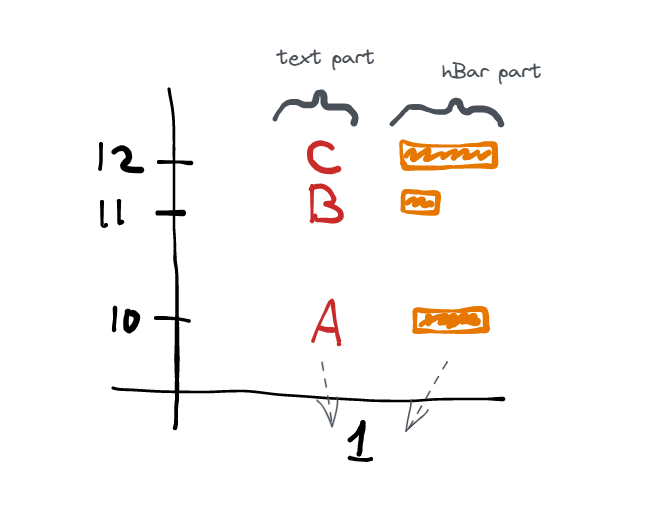
It would also be really cool if we could change the distance between text part and hbar part
Here is the minimum code:
from bokeh.plotting import figure, show, ColumnDataSource

p = figure(x_range=["1"])

all_data = {
    'day'   : ["1", "1", "1"],
    'price' : [10, 12, 13],
    'str'   : ["A", "B", "C"],
}

source = ColumnDataSource(data=all_data)

p.text(x="day", y="price", text="str", source=source)


new_data = {
    # price part same (like in all_data)
    'price' : [10, 12, 13],
    # hbar 'left' data
    'bar_width'   : [1500, 1234, 920],
}

#Hbar here?

show(p)
How can I do that? Thx!