

☰Read-only archive⌕
Looking for help with Bokeh?

This is a read-only archive. Ask questions and join the conversation on GitHub.

Visit Community Support on GitHub →
Archived discussions · Captured October 28, 2026

Misalignment of vertical grey bars for grouped categorical axis

Community Support
joelostblom
joelostblom

I am really enjoying the grouped categorical axes in Bokeh. I find this feature very handy, but it is for some reason not common among the plotting libraries I have seen, so extra thanks for making it available in Bokeh!

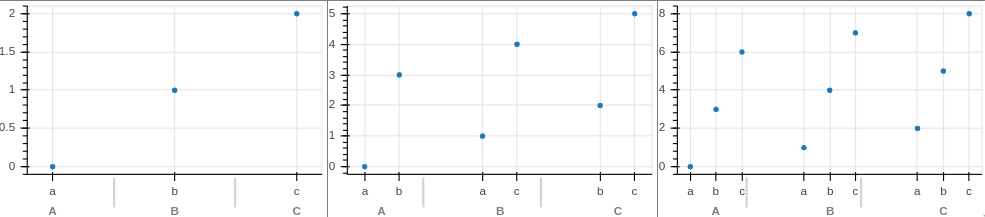
One thing I have noticed is that the vertical grey bars marking the separation of the outer categories seems to not always line up correctly and sometimes it even overlaps with the axis labels for the inner categorical axis, which is confusing and makes it hard to read. I suspect that this is a bug and I can open an issue if you would like, but in the meantime, is there a workaround for either realigning or removing the grey bars?

Sample where the grey bars are misaligned and start to overlap with the ‘c’ label.

from bokeh.io import output_notebook, show
from bokeh.models import ColumnDataSource, FactorRange
from bokeh.plotting import figure, gridplot
import pandas as pd

output_notebook()


num1 = 3
plot_row = []
for num2 in range(1, 4):
    cat1 = list('ABC')[:num1] * num2
    cat2 = ['a'] * num2 + ['b'] * num2 + ['c'] * num2

    df = pd.DataFrame({'cat1': cat1, 'cat2': cat2[:len(cat1)], 'value': range(num1*num2)})
    df['cat_combo'] = df[['cat1', 'cat2']].apply(tuple, axis=1)

    p = figure(
        width=300, height=200,
        x_range=FactorRange(*df['cat_combo'].unique().tolist()))
    p.circle('cat_combo', 'value', source=df)
    plot_row.append(p)
show(gridplot([plot_row]))
Version:

-----
bokeh       2.0.1
pandas      1.0.3
sinfo       0.3.1
-----
IPython             6.5.0
jupyter_client      5.2.3
jupyter_core        4.6.3
jupyterlab          2.1.0
notebook            5.6.0
-----
Python 3.7.6 | packaged by conda-forge | (default, Mar 23 2020, 23:03:20) [GCC 7.3.0]
Linux-5.6.15-arch1-1-x86_64-with-arch-Arch-Linux
4 logical CPU cores

⌁   Link to post
joelostblom
joelostblom

Thank @p-himik, sorting works!

I explored some more and realized that it is the outer categorical items that need to be grouped together for Bokeh to place the grey line correctly. This is good for my application, where I don’t want it to be sorted alphabetically and can be achieved via the following building on my example above:

unique_tuples = df['cat_combo'].unique().tolist()
outer_order = list(dict.fromkeys(x[0] for x in unique_tuples))
grouped_unique_tuples = sorted(unique_tuples, key=lambda x: (outer_order.index(x[0]), x[1]))

Which turns the list in unique_tuples:

[('B', 'a'),
 ('A', 'a'),
 ('C', 'a'),
 ('B', 'b'),
 ('A', 'b'),
 ('C', 'b'),
 ('B', 'c'),
 ('A', 'c'),
 ('C', 'c')]

into this grouped list:

[('B', 'a'),
 ('B', 'b'),
 ('B', 'c'),
 ('A', 'a'),
 ('A', 'b'),
 ('A', 'c'),
 ('C', 'a'),
 ('C', 'b'),
 ('C', 'c')]

Do you think this is something Bokeh should do internally in FactorRange? The grouping preserves the original order and the only effect I see is that they grey bar is aligned correctly, I can’t think of any drawbacks? I can open an issue to track this if you want, or a PR to the docs on nested categories to note that it is necessary to group on the outer level for the grey bars to line up.

⌁   Link to post
p-himik
p-himik

As you have shown yourself in the example, not everybody will want their factors sorted in some predefined way.
But I agree that it could be made more clear and/or we could issue a warning when top-level groups are not contiguous. Since it’s a O(n) check, it’s not a big deal IMO, and I had to answer such question a few times before. So sure, feel free to create an issue or two.

⌁   Link to post
joelostblom
joelostblom

@p-himik I just opened [BUG] Support unsorted/ungrouped labels for nested categorical axes · Issue #10182 · bokeh/bokeh · GitHub. Sorry for the delay, got caught up in deadlines.

Note that the order of the categories in the plot will not change with this solution, so it is not a worry that some users will not want their data sorted. The original plot order is preserved while making sure that the bars are aligned and don’t overlap with the axis labels.

⌁   Link to post

End of archived discussion · Replies are disabled
