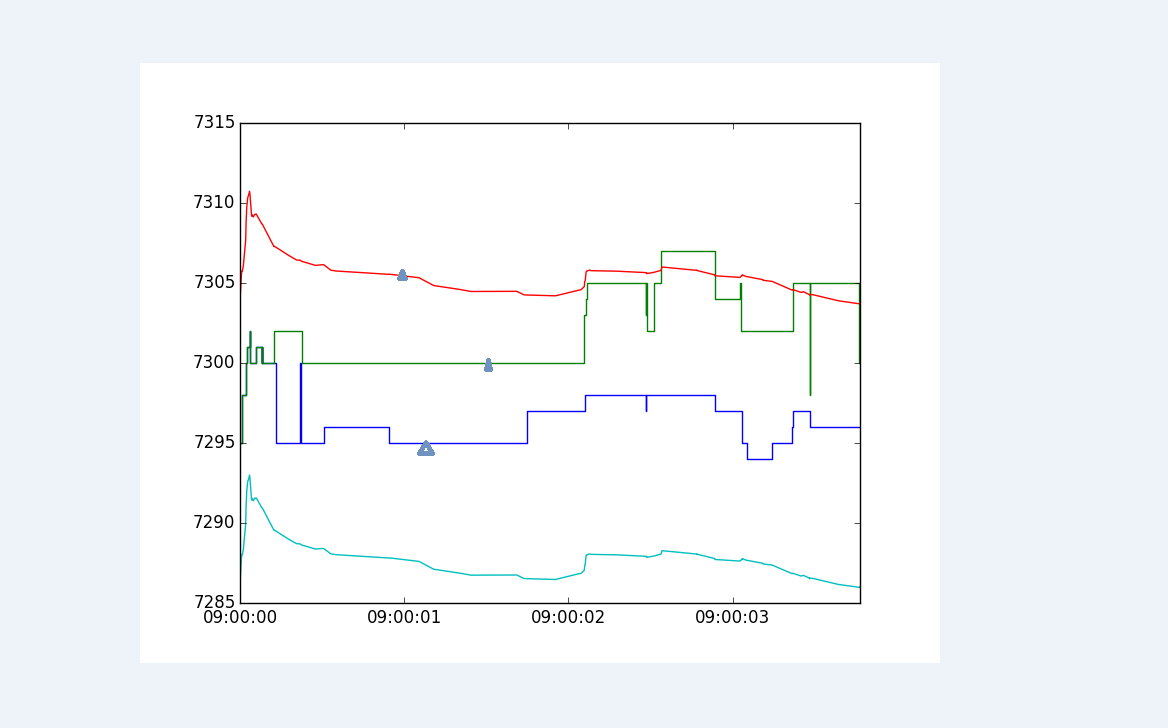
I am trying multiple step time series and point mark overlapping found a bug notice the figure save the png are good but missing few thing in html
Also when i use matplot using to_bokeh its miss the time series
GGPLOT
http://bokeh.pydata.org/en/0.11.1/docs/gallery/step.html
=== Modified little pit added geom_point
from ggplot import aes, geom_step, ggplot , ggsave , geom_point
import matplotlib
import matplotlib.pyplot as plt
import numpy as np
import pandas as pd
from bokeh import mpl
from bokeh.plotting import output_file, show
plt.switch_backend(‘agg’)
matplotlib.use(‘Agg’)
df = pd.DataFrame({
“x”: range(100),
“y”: np.random.choice([-1, 1], 100)
})
df.y = df.y.cumsum()
g = ggplot(aes(x=‘x’, y=‘y’), data=df) + geom_step() + geom_point(aes(x=‘x’, y=‘y’) )
g.draw()
ggsave(plot=g, filename=“t.png” )
plt.title(“Step ggplot-based plot in Bokeh.”)
output_file("/tmp/ggplot_step.html", title=“ggplot_step.py example”)
show(mpl.to_bokeh())
PNG from ggsave
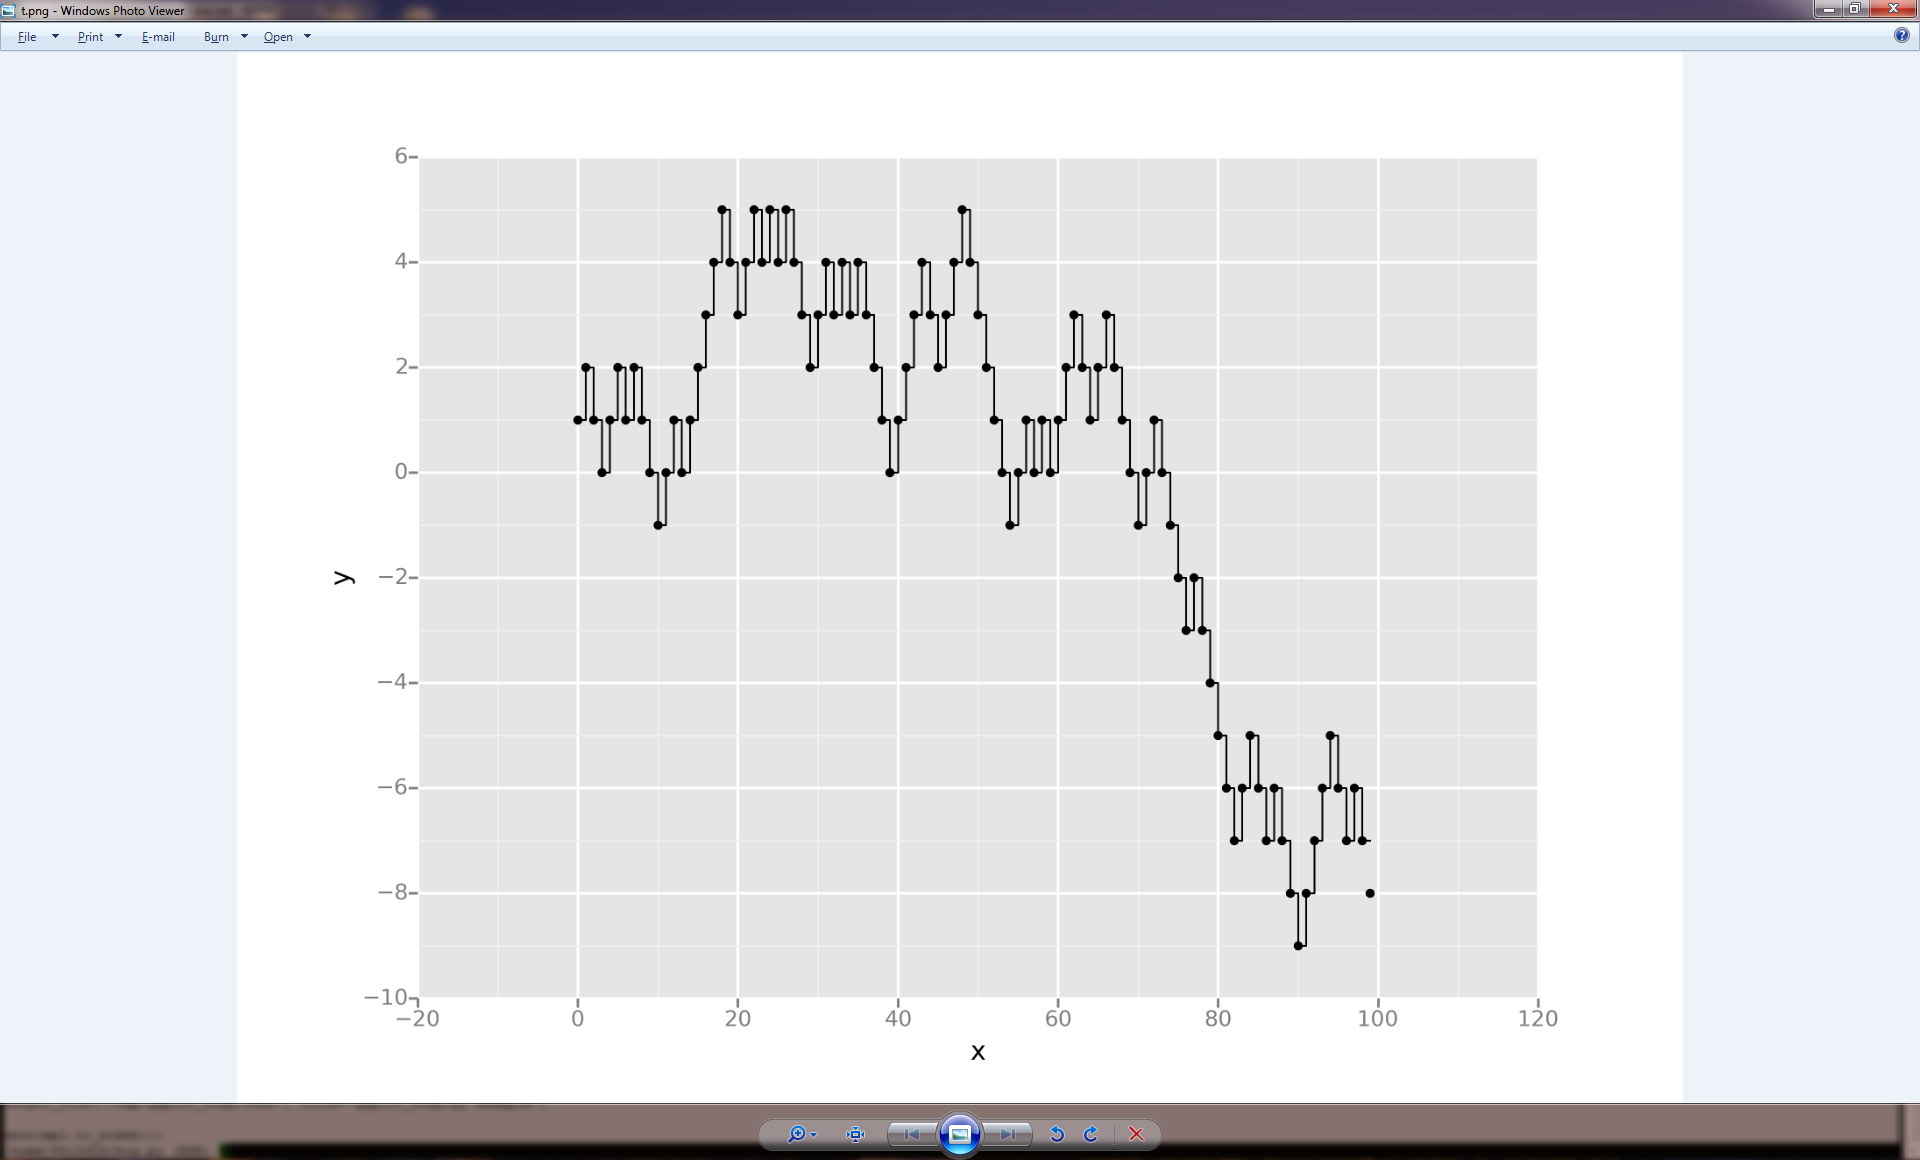
html missing point
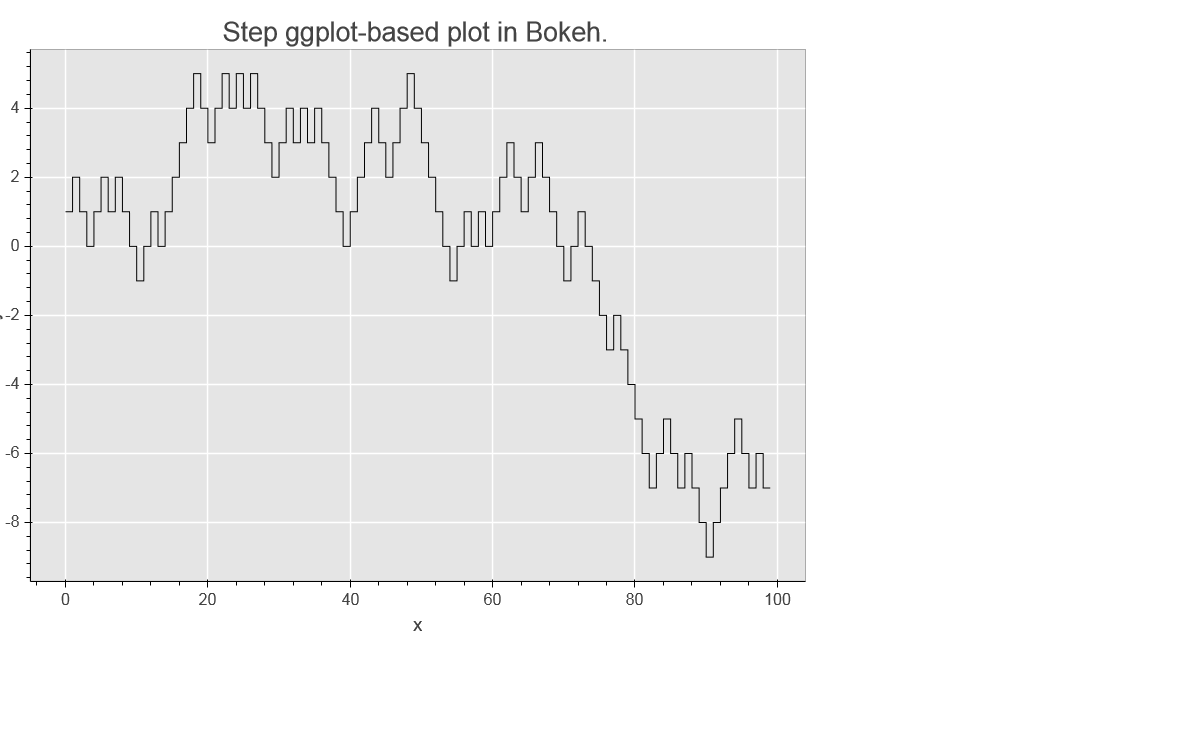
from matplotlib to bokeh conversion
Missing timeseries format
step function is not exact its render as line some time
can have point on figure too
original figure
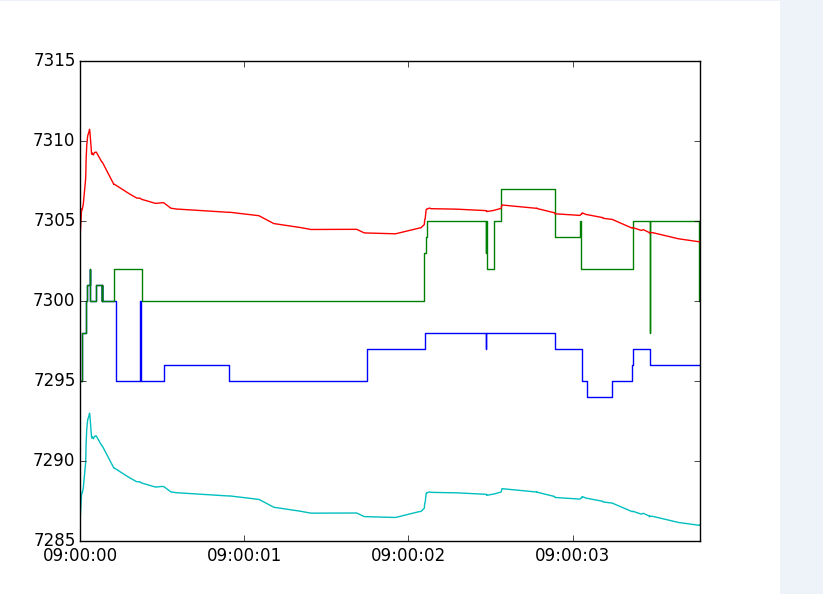
html
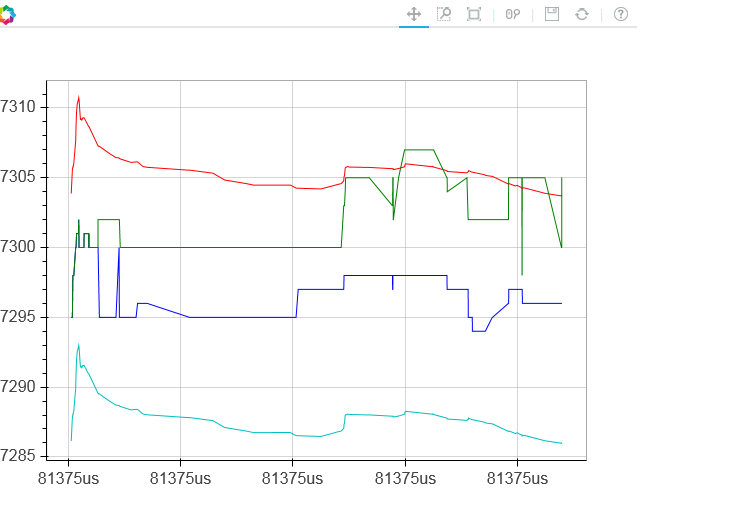
What i want to do something below in HTML view may you can suggest some solution to have some step time series and few marker point on time series
-So for i tried timeseries with different builder doesn’t work
-ggplot step function good but missing the point time series is stilll wrong
-matplotlib also same issue