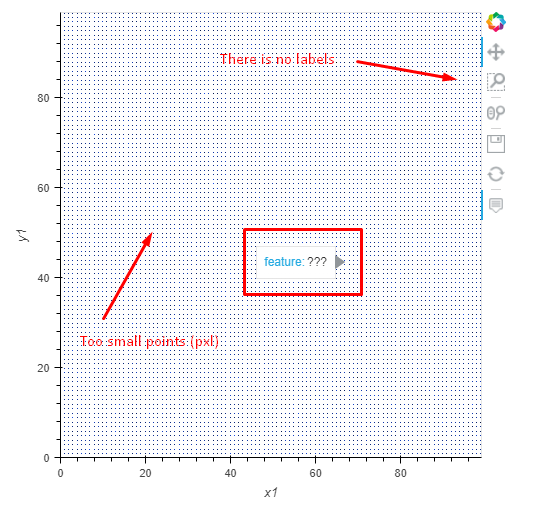
I am trying to draw two groups of scatterplots on one figure as in matplotlib two lines with scatter code. But the data is large and I need to view it interactively. I need to dynamically view some data properties using hover.
I am having trouble with this task. Here are the questions:
- How do I correctly display two or more groups of data on the same fig?
- How do I set specific colors for data for the user to recognize it? For example group 1 is red and group 2 is blue.
- How to add hover with displaying properties from dataframe for all DISPLAYED data?
- How to add the ability to turn off the display of selected dynamically groups?
I tried to implement orisovka taking “Multidimensional plots” as an example in the documentation
Working with large data using datashader
However, this example was not clear to me. I’m not sure if I need to use some functions like NdOverlay or dynspread. Also, I cannot figure out how to set specific colors for specific data. Perhaps this is what I need to do, and if this is so, then please show me exactly where I need to pay attention.
This applied to questions 1 and 2.
Here is the code with sample data and my attempt to solve the problem.
import pandas as pd
import random
import numpy as np
import holoviews as hv
import datashader as ds

from holoviews import opts
from holoviews.operation.datashader import datashade, dynspread
hv.extension('bokeh')

#Data can contain much more data and features
#Here, for example, only two data groups and one feature
N=int(10e5)
df = pd.DataFrame(np.random.randint(0,100,size=(N, 4)), columns=list(('x1','y1','x2','y2')))
df['feature']=np.random.random(N)

#This is where questions begin about how to do it correctly or fix the existing code
Data_1 = hv.Points((df['x1'],df['y1']),label="Data_1")
Data_2 = hv.Points((df['x2'],df['y2']),label="Data_2")

data_i_want_to_plot={'Data_1':Data_1,'Data_2':Data_2 }

c = dynspread(datashade(hv.NdOverlay(data_i_want_to_plot, kdims='k'), aggregator=ds.by('k', ds.count())))
c.opts(width=800, height=800).relabel('System')
Regarding questions 3 and 4, I have no idea how to do this at all, so please tell me how to do this. In the example above, this possibility should already be taken into account in the future.
Thanks in advance!


 If you use the overlay option with