

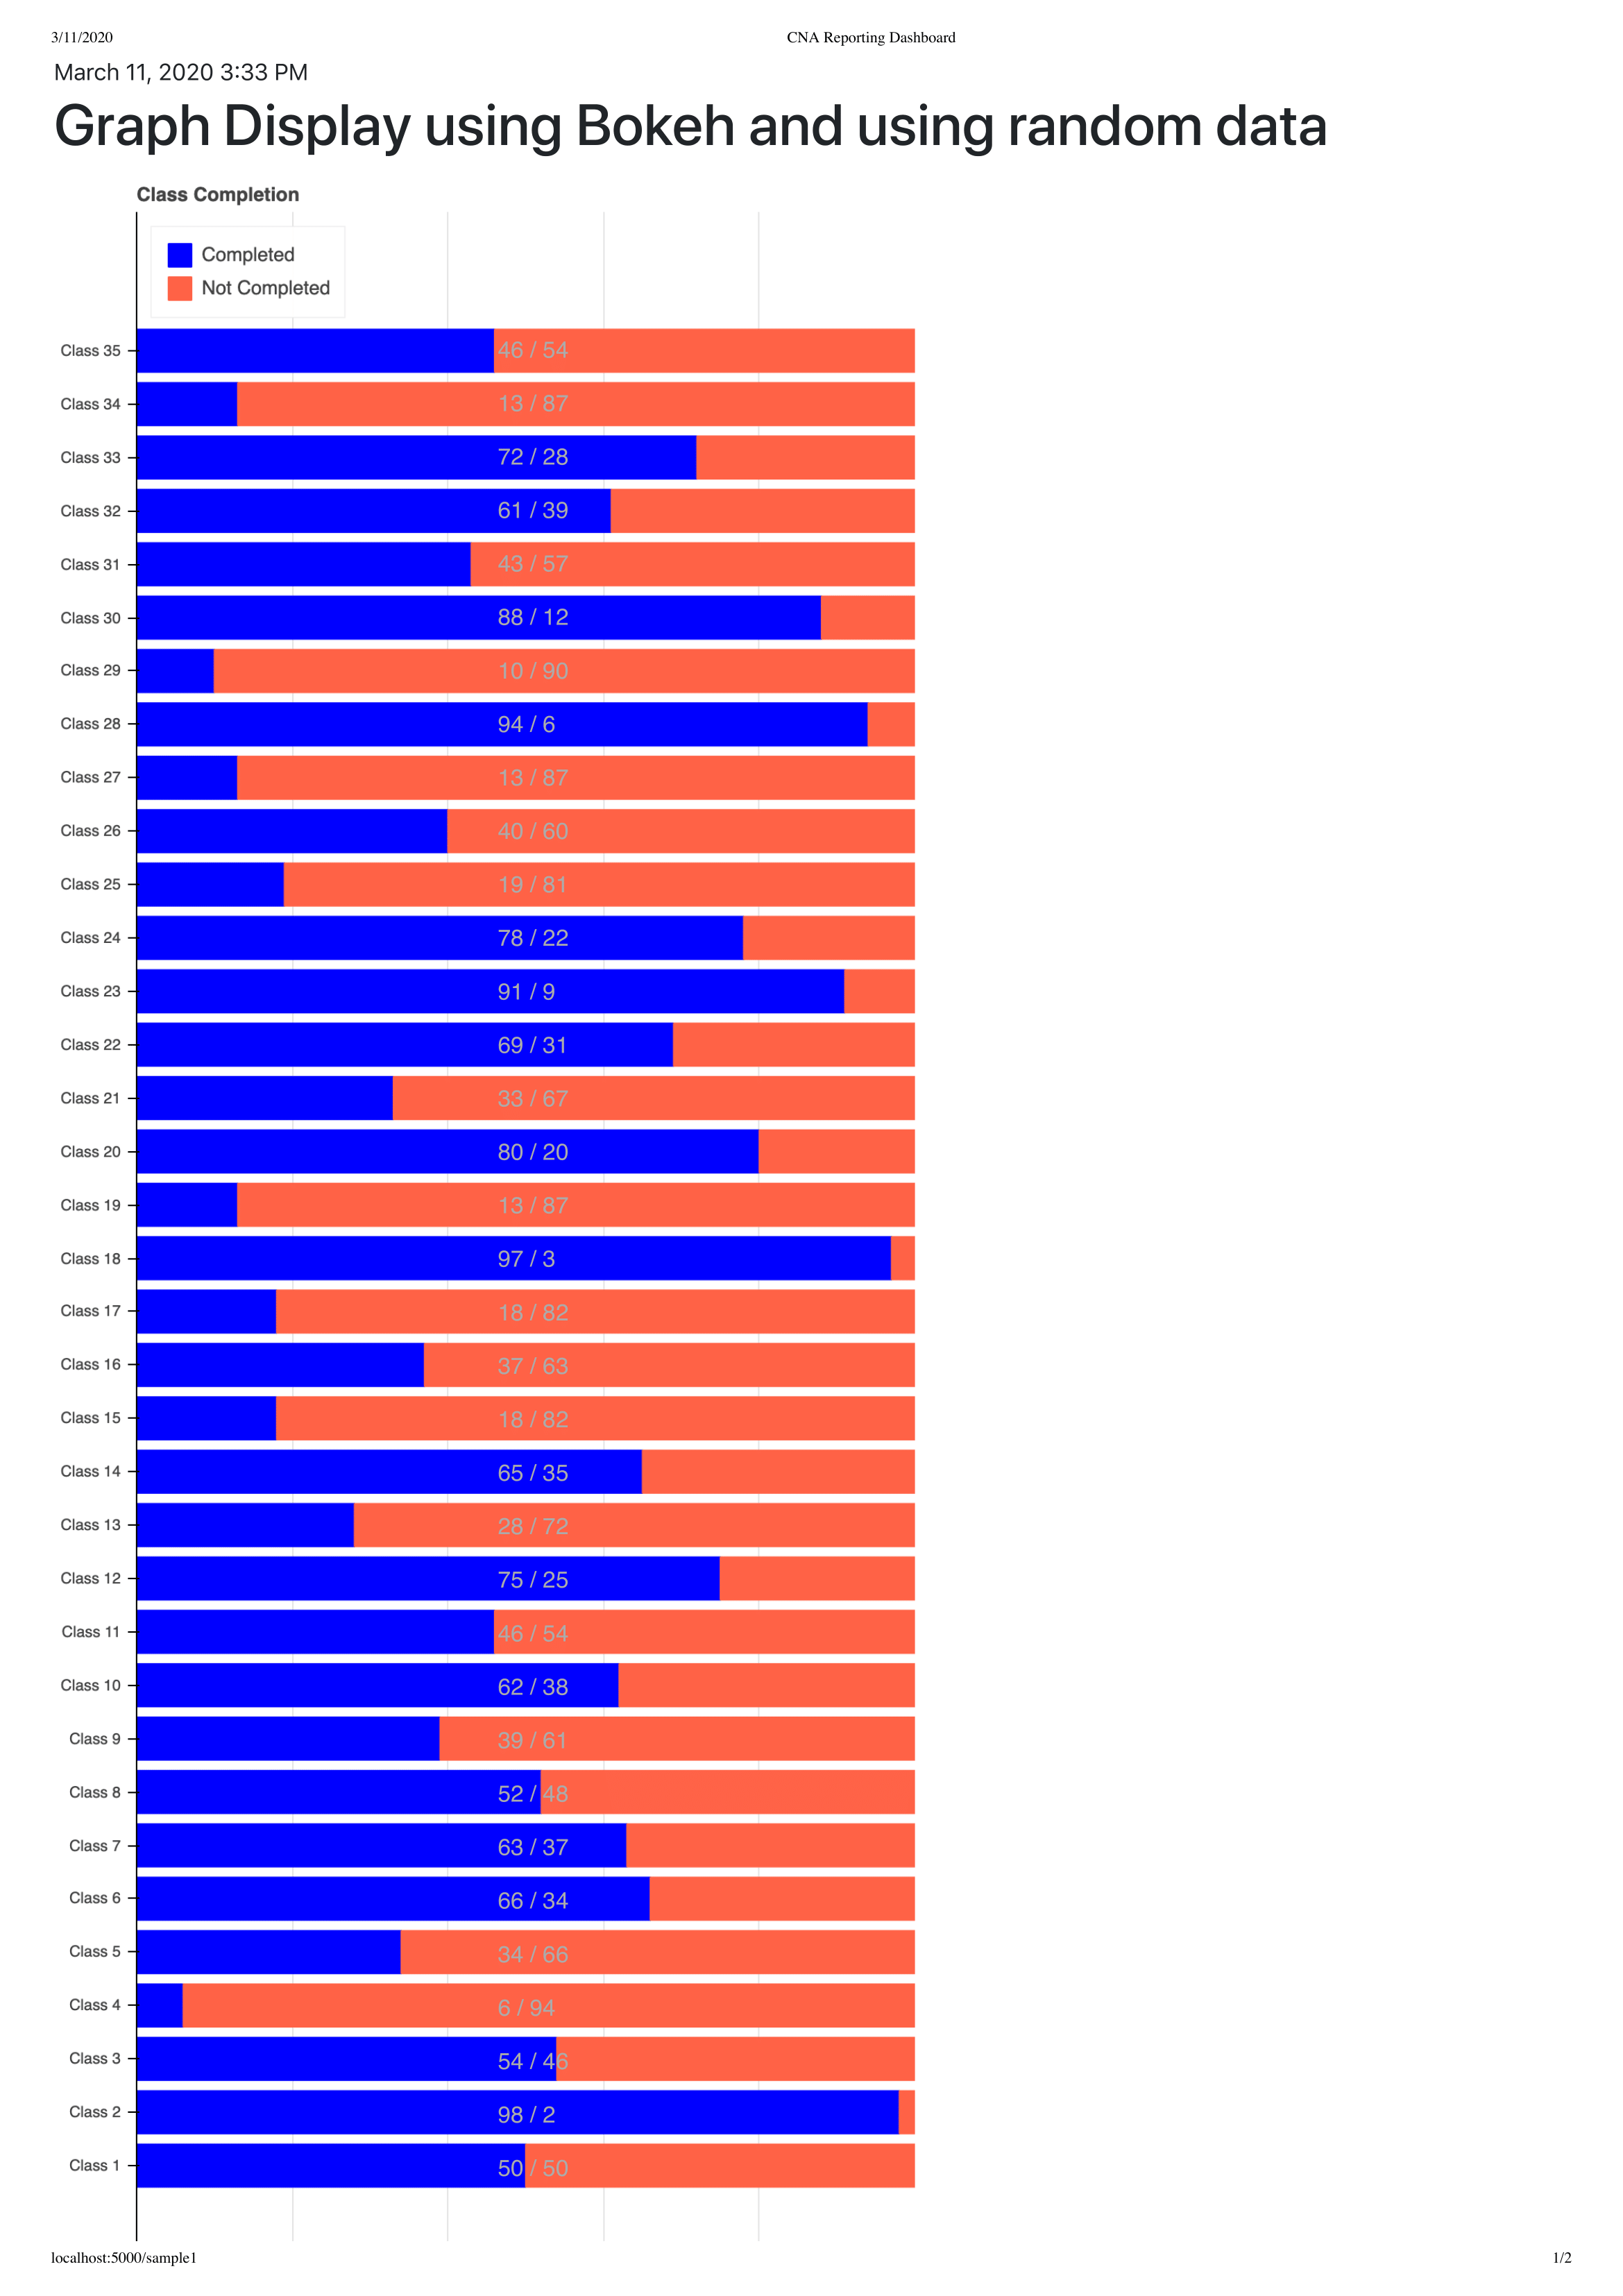
Hello, I’m new to web development and I’m working on making a reporting dashboard. Please see the attached pdf of what I have so far.
I have two questions:
-
Is it possible to disable the interactivity of the graph? When I click on it I am able to drag it around, but this is not something I want to happen. Any way to disable it? I would prefer it remain static
-
Is there any way to add a hyperlink to specific parts of the graph? I want to allow users to click on any of the 35 classes and on the side to display more information on the class (such as a complete list of users) Any suggestions would be appreciated.
-
Where can I find the full documentation? For example, I am trying to use the hover class and I found it in the reference here but it does not seem to have any examples or actual code that I can read, it just talks about the class. Is this it? I’m very new so I have no idea what I am doing.
Thank you!

